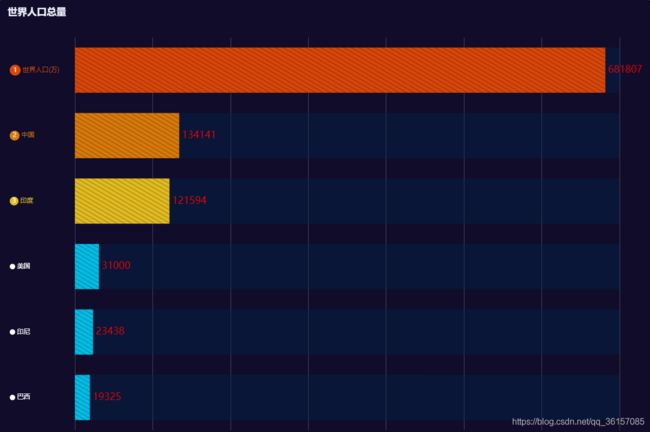
Echarts-横向柱状图实现
- label,bar的颜色设置
- y轴label文字样式设置
- 文字居左展示
- 前缀序号,圆圈样式
let colors = {
    1: "rgba(216,70,10,1)",
    2: "rgba(216,121,10,1)",
    3: "rgba(226,187,32,1)",
    4: "rgba(2,189,229,1)",
}
option = {
    title: {
        text: '世界人口总量'
    },
    tooltip: {
        trigger: 'axis',
        axisPointer: {
            type: 'shadow'
        }
    },
    grid: {
        left: '-7%',
        right: '4%',
        bottom: '3%',
        containLabel: true
    },
    xAxis: {
        type: 'value',
        axisLabel: {
            show: false
        },
        axisTick: {
            show: false
        },
        axisLine: {
            show: false,
        },
    },
    yAxis: {
        type: 'category',
        inverse: true,
        axisTick: {
            show: false
        },
        axisLine: {
            show: false,
        },
        axisLabel: {
            margin: 120,
            textStyle: {
              align: 'left',
              color: (value, index) => {
                let sequence = index + 1;
                return sequence < 4 ? colors[sequence] : colors[4];
              },
            },
            formatter: (value, index) => {
              let sequence = index + 1;
              if (sequence == 1) {
                return "{one|1} {a|" + value + "}";
              } else if (sequence == 2) {
                return "{two|2} {b|" + value + "}";
              } else if (sequence == 3) {
                return "{three|3} {c|" + value + "}";
              }
              return "{default|} {d|" + value + "}";
            },
            rich: {
              a: {
                color: "rgba(216,70,10,1)",
              },
              b: {
                color: "rgba(216,121,10,1)",
              },
              c: {
                color: "rgba(226,187,32,1)",
              },
              d: {
                color: "white",
              },
              one: {
                backgroundColor: "rgba(216,70,10,1)",
                width: 20,
                height: 20,
                align: "center",
                color: "white",
                borderRadius: 10,
              },
              two: {
                backgroundColor: "rgba(216,121,10,1)",
                width: 18,
                height: 18,
                color: "white",
                align: "center",
                borderRadius: 9,
              },
              three: {
                backgroundColor: "rgba(226,187,32,1)",
                width: 16,
                height: 16,
                color: "white",
                align: "center",
                borderRadius: 8,
              },
              default: {
                backgroundColor: "white",
                width: 10,
                height: 10,
                borderRadius: 5,
              },
            },
          },
        data: ['世界人口(万)', '中国', '印度', '美国', '印尼', '巴西']
    },
    series: [
        {
            name: '2012年',
            type: 'bar',
            label: {
              show: true,
              position: 'right',
              textStyle: {
                color: "red",
                fontSize: 18,
              },
            },
            showBackground: true,
            backgroundStyle: {
              color: "rgba(1,38,74,0.4)"
            },
            data: [681807, 134141, 121594, 31000, 23438, 19325],
            itemStyle: {
              normal: {
                color: (serie) => {
                  let sequence = serie.dataIndex + 1;
                  return sequence < 4 ? colors[sequence] : colors[4];
                },
              },
            }
        }
    ]
};
拷贝到Echarts示例当中查看即可;
