机器学习模型 非线性模型
A Case Study of Shap and pdp using Diabetes dataset
使用糖尿病数据集对Shap和pdp进行案例研究
Explaining Machine Learning Models has always been a difficult concept to comprehend in which model results and performance stay black box (hidden). In this post, I seek to explain the result of a ML model I built with the help of two major libraries SHAP and Partial Dependence Plot. The dataset is originally from the National Institute of Diabetes and Digestive and Kidney Diseases. The objective of the dataset is to diagnostically predict whether or not a patient has diabetes, based on certain diagnostic measurements included in the dataset. Several constraints were placed on the selection of these instances from a larger database. In particular, all patients here are females at least 21 years old of Pima Indian heritage.
解释机器学习模型一直是一个很难理解的概念,其中模型的结果和性能始终处于黑匣子(隐藏)状态。 在这篇文章中,我试图解释借助两个主要库SHAP和Partial Dependence Plot构建的ML模型的结果。 该数据集最初来自美国国立糖尿病与消化与肾脏疾病研究所。 数据集的目的是基于数据集中包含的某些诊断测量值来诊断预测患者是否患有糖尿病。 从较大的数据库中选择这些实例受到一些限制。 特别是,这里的所有患者均为女性,至少有21岁的皮马印第安人血统。
The dataset consists of several medical predictor variables. Predictor variables include the number of pregnancies the patient has had, their BMI, insulin level, age, and so on. The major goal of the data was to answer the question “Can you build a machine learning model to accurately predict whether or not the patients in the dataset have diabetes”.
数据集由几个医学预测变量组成。 预测变量包括患者怀孕次数,BMI,胰岛素水平,年龄等。 数据的主要目的是回答“您是否可以建立一个机器学习模型来准确预测数据集中的患者是否患有糖尿病”这一问题。
The steps took to build the machine learning model are as follows:
建立机器学习模型的步骤如下:
- Exploratory Data Analysis (Uni-variate and Bi-variate Analysis) 探索性数据分析(单变量和双变量分析)
2. Feature Engineering and Feature Selection
2.特征工程与特征选择
3. Baseline and comparison of several ML models on a metric
3.在一个度量标准上对几种ML模型进行基线和比较
4. Performing hyperparameter Tuning on the Selected Algorithm
4.对所选算法执行超参数调整
5. Interpretation of the model Result
5.解释模型结果
Ëxploratory数据分析 (Exploratory Data Analysis)
Exploring Data is a paramount and important step for any data science project. This will enable you (Data Scientist) to understand the kind of features you are working with and how it relate to the question you are trying to answer. EDA can be broadly split into Uni-variate Analysis and Bi-variate Analysis.
对于任何数据科学项目来说,探索数据都是至关重要的一步。 这将使您(数据科学家)能够了解正在使用的功能类型以及它们与您要回答的问题的关系。 EDA可以大致分为单变量分析和双变量分析。
Uni-variate Analysis broadly entails checking the feature distribution, this can help answer the question if the feature distribution is skewed or if there are missing values in the feature.
单变量分析广泛地需要检查特征分布,这可以帮助回答以下问题:特征分布是否倾斜或特征中是否缺少值。
Bi-variate Analysis is concerned with two features to explore how they relate with each other. Generally, it is advised to take one (1) feature and the target variable as this will save time and effort especially if a model is to be built. The complete analysis can be found here
双变量分析涉及两个功能,以探讨它们之间的关系。 通常,建议采用一(1)个功能和目标变量,因为这将节省时间和精力,尤其是在要构建模型的情况下。 完整的分析可以在这里找到
Let us Understand the describe function of pandas Quick Question: What does it mean to have a standard deviation (std) close to the mean? Firstly, what is std? Standard deviation is a number used to tell how measurement for a group are spread out from the average (mean), or expected value. A low std means that most of the numbers are closer to the meanwhile a higher std means that the numbers are more spread out. So to answer the question what it means to have a std closer to mean like mean is 100 and std is 50, then the data in this group are widely spread out and if a group has mean = 100 and std = 10, then the data is marginally spread out that is the data has a long cone when visually checked out, that is the data are within a small range.
让我们了解大熊猫的描述功能 快速问题 :标准偏差(std)接近均值意味着什么? 首先,什么是std? 标准偏差是一个数字,用于指示组的度量如何从平均值(均值)或期望值中扩展。 std值低意味着大多数数字都接近于此,而std值越高意味着数字越分散。 因此,要回答这个问题,使标准差更接近均值(例如均值是100,标准差是50)意味着什么,那么该组中的数据将广泛散布,如果一组均值= 100并且标准差= 10,则该数据略微散开,即在视觉上检出时数据具有较长的圆锥,即数据在较小范围内。
Another Quick Question: What do you understand by 25% and 75% of a group of data? so to answer that we need to know what percentile really means? so what is percentile? Percentile is defined in various ways, percentile is a number where a certain percentage of scores fall below or equal to that number. so in a test you score 67 out of 90 and you fall into the 90th percentile, that means you scored better than 90% of people who took the test. the 25th percentile is called first quartile, the 50th percentile is called the median and 75th percentile is called the third quartile. The difference between the third and first quartile is the interquartile range. So to answer the question, 25% means 25% of the data falls below that value and the 75% means 75% of the data falls below that value.
另一个快速问题 :您对一组数据的25%和75%了解什么? 所以要回答,我们需要知道百分位数真正意味着什么? 那么什么是百分位数? 百分位数有多种定义,百分位数是分数的某个百分比低于或等于该数字的数字。 因此,在一项测试中,您在90分中获得67分,并且落在第90个百分位,这意味着您的得分比参加该测试的人90%要好。 第25个百分位数称为第一四分位数,第50个百分位数称为中位数,第75个百分位数称为第三四分位数。 第三个四分位数与第一个四分位数之间的差是四分位数间距。 因此要回答这个问题,25%表示25%的数据低于该值,而75%表示75%的数据低于该值。
According to the site where the data was gotten from, 0 are used to represent missing values so when we check for missing with isnull() we get nothing we need to check for zero and need to be careful doing so too because we don't want to change the target values.
根据获取数据的站点,0用于表示缺失值,因此当我们使用isull()检查缺失时,我们什么也没有得到,我们需要检查零,也需要小心,因为我们不会要更改目标值。

Feature Engineering
特征工程
This is the process of generating/ adding new features to already existing features either by aggregating or transforming features in other to improve the performance of the model. Log transform was taken to correct the data skewness.
这是通过对其他要素进行聚合或转换以提高模型性能的方法,将新要素生成/添加到现有要素中。 进行对数变换以纠正数据偏斜。
df['log_SkinThickness'] = np.log(df['SkinThickness'])df['log_Insulin'] = np.log(df['Insulin'])df['log_BMI'] = np.log(df['BMI'])df['log_Age'] = np.log(df['Age'])df.head()
df['BloodSugar'] = np.abs(df['Insulin'] - df['Glucose'])df['high_BMI'] = df['BMI'].apply(lambda x: 1 if x > 30 else 0)cm = np.corrcoef(df[cols].values.T)f, ax = plt.subplots(figsize=(14, 12))sns.heatmap(cm, vmax=.8, linewidths=0.01, square=True, annot=True, cmap='viridis', linecolor='white',xticklabels=cols.values, annot_kws={'size':12}, yticklabels=cols.values)Select Features for model
选择模型特征
cols = cols.drop(['Outcome'])features = df[cols]target = df['Outcome']features.head()Performance Metric = Accuracy
Performance Metric = 准确性
The baseline for this model based on the chosen metric will be 70%. What this means is that any algorithm giving accuracy less than 70% will be discarded, at the long run the algorithm with the highest accuracy score will be selected. The data was scaled using Standard Scaler to reduce model bias.
基于所选指标的此模型的基准为70%。 这意味着任何精度低于70%的算法都将被丢弃,从长远来看,将选择精度最高的算法。 使用Standard Scaler缩放数据以减少模型偏差。
Establishing a Baseline Model
建立基准模型
A Baseline Model is a simple model that is to be improved. It is basically, building a model using the default parameters of an algorithm to understand the performance and detect some important features. Some Models that were built include Logistic Regression, Random Forest, Gradient Boosting, K-nearest Neighbors.
基准模型是一个有待改进的简单模型。 基本上,使用算法的默认参数构建模型以了解性能并检测一些重要功能。 建立的一些模型包括逻辑回归,随机森林,梯度提升,K近邻。
逻辑回归 (Logistic Regression)
log_reg = linear_model.LogisticRegression()list_scores = []log_reg.fit(features, target)log_reg_score = cross_val_score(log_reg, features, target, cv=10, scoring='accuracy').mean()print(log_reg_score)list_scores.append(log_reg_score)0.7695488721804511邻居分类器 (KNeighbours Classifier)
cv_scores = []# --- number of folds ---folds = 10#---creating odd list of K for KNN--ks = list(range(1,int(len(features) * ((folds - 1)/folds)), 2))#---perform k-fold cross validation--for k in ks:knn = neighbors.KNeighborsClassifier(n_neighbors=k)score = cross_val_score(knn, features, target, cv=folds, scoring='accuracy').mean()cv_scores.append(score)#---get the maximum score--knn_score = max(cv_scores)#---find the optimal k that gives the highest score--optimal_k = ks[cv_scores.index(knn_score)]print(f"The optimal number of neighbors is {optimal_k}")print(knn_score)0.7747436773752565list_scores.append(knn_score)The optimal number of neighbors is 17Other Models that were built include: Gradient Boost Classifier, Support Vector Machine and Random Forest.
构建的其他模型包括:梯度Boost分类器,支持向量机和随机森林。
Selecting Best Model
选择最佳模型

K-Neighbor performance as measured by accuracy is the best model and i moved to hyper-parameter tuning.
用精度衡量的K邻域性能是最好的模型,我转向了超参数调整。
Performing Hyper parameter Tuning on the Selected Algorithm
对所选算法执行超参数调整
cv_scores = []# --- number of folds ---folds = 30#---creating odd list of K for KNN--ks = list(range(1,int(len(features) * ((folds - 1)/folds)), 2))#---perform k-fold cross validation--for k in ks: knn = neighbors.KNeighborsClassifier(n_neighbors=k) score = cross_val_score(knn, features, target, cv=folds, scoring='accuracy').mean() cv_scores.append(score)#---get the maximum score--knn_score = max(cv_scores)#---find the optimal k that gives the highest score--optimal_k = ks[cv_scores.index(knn_score)]print(f"The optimal number of neighbors is {optimal_k}")print(knn_score)# result.append(knn_score)The optimal number of neighbors is 19New Accuracy after Hyper-parameter tune is 0.80解释模型结果 (Interpreting the model Result)
Permutation Importance using ELI5 library
使用ELI5库的排列重要性
What features does a model think are important? What features might have a greater impact on the model predictions than the others? This is called feature importance and permutation importance which are techniques used widely for calculating feature importance. It helps to see when our model produces counter-intuitive results and it helps to show the others when our model is working as we’d hope.
模型认为哪些功能很重要? 哪些功能可能比其他功能对模型预测的影响更大? 这被称为特征重要性和置换重要性,它们是广泛用于计算特征重要性的技术。 它有助于查看我们的模型何时产生违反直觉的结果,并有助于向其他人展示我们的模型何时如我们期望的那样工作。
The idea is simple: Randomly permutate or shuffle a single column in the validation dataset leaving all the other columns intact. A feature is considered important if the model’s accuracy drops a lot and causes an increase in error when it not included as a feature to build the model. On the other hand, a feature is considered ‘unimportant’ if shuffling its values do not affect the models accuracy.
这个想法很简单:在验证数据集中随机排列或随机排列单个列,而所有其他列保持不变。 如果模型的准确性下降很多,并且在不将其作为构建模型的特征时会导致误差增加,则认为该特征很重要。 另一方面,如果将特征的值改组不影响模型的准确性,则认为该特征“不重要”。
Permutation importance is useful for debugging, understanding your model, and communicating a high-level overview from your model. Permutation importance is calculated after a model has been fitted. ELI5 is a python library which allows to visualize and debug various ML models using unified API. it has built-in support for several ML frameworks and provides a way to explain black-box models
排列的重要性对于调试,理解模型以及传达模型的高层概述很有用。 拟合重要性是在模型拟合后计算的。 ELI5是一个Python库,可以使用统一的API可视化和调试各种ML模型。 它具有对多个ML框架的内置支持,并提供了一种解释黑匣子模型的方法
# calculating and Displaying importance using the eli5 libraryplt.figure(figsize=[10,10])import eli5from eli5.sklearn import PermutationImportanceperm = PermutationImportance(model, random_state=1).fit(X_test, y_test)eli5.show_weights(perm, feature_names=X_test.columns.tolist())
Interpretation
解释
The features at the top are the most important and at the bottom, the least. For example, Glucose level is the most important feature which can decide whether a person will have diabetes, which also makes sense. The number after +/- measures how performance varied from one reshuffling to the next. Some weights are negative which means that the feature does not have high impact in deciding whether or not patient has diabetes.
顶部的功能最重要,底部的功能最少。 例如,葡萄糖水平是最重要的特征,可以决定一个人是否患有糖尿病,这也很有意义。 +/-之后的数字表示从一次改组到下一次改组的性能变化。 一些权重是负的,这意味着该特征在确定患者是否患有糖尿病方面没有很大的影响。
Partial Dependence Plots
部分依赖图
The partial dependence plot (pdp) shows the marginal effect one or two features have on the predicted outcome of a ML model. PDP shows how a feature affects predictions. PDP can show the relationship between the target and the selected features via 1d or 2D plots.
偏相关图(pdp)显示了一个或两个特征对ML模型的预测结果的边际影响。 PDP显示功能如何影响预测。 PDP可以通过1d或2D图显示目标和选定要素之间的关系。
from pdpbox import pdp, get_dataset, info_plotsfeatures_name = [i for i in features.columns]pdp_goals = pdp.pdp_isolate(model=model, dataset=X_test, model_features=features_name, feature='Glucose')pdp.pdp_plot(pdp_goals, 'Glucose')plt.show()
From the chart above, glucose level below 100, the probability of a patient having diabetes is low. As the Glucose level increases beyond 110, the chance of patients having diabetes increases rapidly from 0.2 through 0.4 at Glucose level 140 and impulsively to 0.8 at Glucose level 200.
从上图可以看出,如果葡萄糖水平低于100,则患者患糖尿病的可能性较低。 随着葡萄糖水平增加到超过110,糖尿病患者的机会从葡萄糖水平140的0.2Swift增加到0.4,而在葡萄糖水平200的脉冲中Swift增加到0.8。
Glucose level beyond 110 poses patients at high risk of having diabetes while if below 100, the risk is low.
葡萄糖水平超过110会使患者罹患糖尿病的风险很高,而低于100则意味着风险较低。
pdp_goals = pdp.pdp_isolate(model=model, dataset=X_test, model_features=features_name, feature='log_Insulin')
pdp.pdp_plot(pdp_goals, 'log_Insulin')
The Y-axis represents the change in prediction from what it would be predicted at the baseline or leftmost value. Blue area denotes the confidence interval.For the ‘Insulin’ graph, we observe that probability of a person having diabetes slightly increases continuously as the Insulin level goes up and then remains constant.
Y轴表示预测值相对于基线或最左值的预测值的变化。 蓝色区域表示置信区间。对于“胰岛素”图,我们观察到患有糖尿病的人的概率会随着胰岛素水平的升高而持续增加,然后保持恒定。

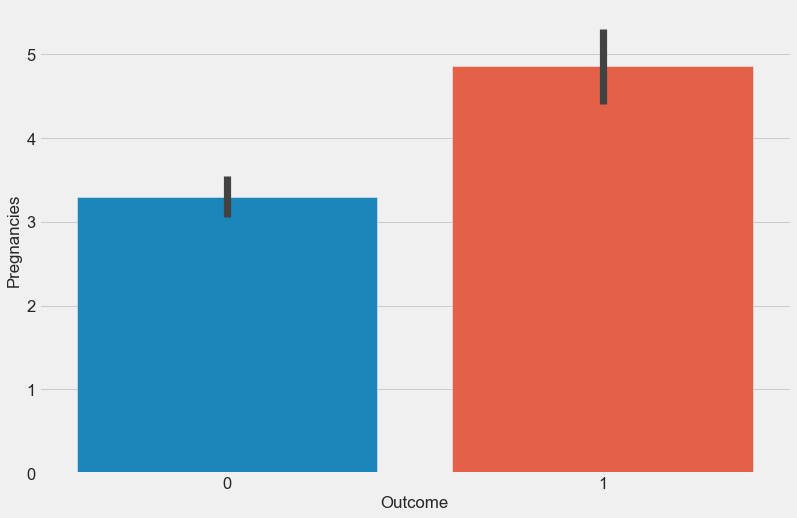
The chart above says if number of pregnancies is greater than 7, probability of having diabetes will increase by 0.1. This means that, as the number of pregnancy increases beyond 8, the probability of having diabetes also increases.
上表显示,如果怀孕次数大于7,则患糖尿病的可能性将增加0.1 。 这意味着,随着怀孕次数增加到8次以上,患糖尿病的可能性也会增加。

From the Age plot above,it can be observed that younger people has lower chance of having diabetes. The age range (27–29) experience a slight downward trend in probability of having diabetes. According to healthline, Middle-aged and older adults are still at the highest risk for developing type-2 diabetes. In 2015, adults aged 45 to 64 were the most diagnosed age group for diabetes and it conforms to what the model explains as the probability of having diabetes continuously increases as the age of patient increases beyond 49 years.
从上面的年龄图可以看出,年轻人患糖尿病的机会较低。 27-29岁年龄段患糖尿病的可能性略有下降。 根据healthline的数据 ,中年和老年人仍然是罹患2型糖尿病的最高风险。 2015年,年龄在45岁至64岁之间的成年人是诊断最多的糖尿病年龄组,符合该模型的解释,即随着患者年龄超过49岁,患糖尿病的可能性不断增加。
使用SHAP值解释模型结果 (Using SHAP values to explain model results)
SHAP stands for SHapley Additive exPlanation. It helps to break down a prediction to show the impact of each feature. it is based on Shapley values, a technique used in game theory to determine how much each player in a collaborative game has contributed to its success. Normally, getting the trade-off between accuracy and interpreting model results the right way can be a difficult task but with SHAP values, it easy to achieve both.
SHAP代表SHapley Additive exPlanation。 它有助于分解预测以显示每个功能的影响。 它基于Shapley值,这是博弈论中使用的一种技术,用于确定协作游戏中每个玩家对其成功的贡献程度。 通常,以正确的方式在准确性和解释模型结果之间进行权衡可能是一项艰巨的任务,但使用SHAP值,可以轻松实现两者。
SHAP is a game theoretic approach to explain the output of any machine learning model. It connects optimal credit allocation with local explanations using the classic Shapley values from game theory and their related extensions.
SHAP是一种博弈论方法,用于解释任何机器学习模型的输出。 它使用来自博弈论的经典Shapley值及其相关扩展,将最佳信用分配与本地解释联系起来。

diabetes and pregnancies follows suite in decreasing order 该图显示, 葡萄糖对 diabetes和 妊娠有很大影响, 妊娠随降序排列
At a lower Glucose level and a small number of pregnancy, the chance/probability of having diabetes is low. As the value of Glucose level increases the probability also increases which further suggest that higher Glucose level means higher probability of having diabetes.
在较低的葡萄糖水平和少量妊娠的情况下,患糖尿病的机会/可能性较低。 随着葡萄糖水平值的增加,可能性也增加,这进一步表明较高的葡萄糖水平意味着患糖尿病的可能性更高。

Glucose and number of pregnancy are good predictors to determine if a patient has diabetes or not and it can be concluded that the higher their values are the higher the chance of having diabetes.
葡萄糖和妊娠次数是确定患者是否患有糖尿病的良好预测指标,可以得出结论,他们的值越高,患糖尿病的机会越大。
With the chart above, you can interact with some of the features used to build the model and see how each vary and affect the decision of the model.
使用上面的图表,您可以与用于构建模型的某些功能进行交互,并查看每个功能如何变化并影响模型的决策。
推荐和结论 (Recommendation and Conclusion)
I will like to start with knowing about the data and give a summary about the findings
我想从了解数据开始,并总结一下调查结果
Know about the data
了解数据
Explain Findings
解释发现
Recommendation
建议
Know about the data This dataset is originally from the National Institute of Diabetes and Digestive and Kidney Diseases. The objective of the dataset is to diagnostically predict whether or not a patient has diabetes, based on certain diagnostic measurements included in the dataset.
了解数据该数据集最初来自美国国立糖尿病与消化与肾脏疾病研究所。 数据集的目的是基于数据集中包含的某些诊断测量值来诊断预测患者是否患有糖尿病。
Can you build a machine learning model to accurately predict whether or not the patients in the dataset have diabetes or not? I believe i have answered this question.
您是否可以建立机器学习模型来准确预测数据集中的患者是否患有糖尿病? 我相信我已经回答了这个问题。
Explain Findings Features like Glucose and Blood Pressure are normally distributed while Features like Age, BMI, Insulin, Skin Thickness are Skewed. The Skewed features was handled by taking the logarithm of the values and that was how it was use to build the model. While Interpreting the result of the model, Assumptions like if pregnancy is more than 7, increases the chance of having diabetes was verified to be true. Also assumption that: if glucose level is high i.e glucose > 140, then probability of having diabetes is high or increases was also verified to be true. it was discovered that features like Glucose contribute to people having diabetes, also high BMI will increase the chance of having diabetes. if Insulin level is high, the chance of having diabetes will reduce. Also, a low level of Glucose and small value of Pregnancy will reduce the chance of having diabetes.
说明结果葡萄糖和血压等功能正常分布,而年龄,BMI,胰岛素,皮肤厚度等功能偏斜。 通过获取值的对数来处理偏斜特征,这就是用来构建模型的方式。 在解释模型的结果时,假设if pregnancy is more than 7, increases the chance of having diabetes was verified to be true 。 还假设: if glucose level is high ie glucose > 140, then probability of having diabetes is high or increases was also verified to be true 。 研究发现,葡萄糖等功能会助长糖尿病患者的生命,而高BMI也会增加患糖尿病的机会。 如果Insulin水平高,则患糖尿病的机会会减少。 同样,低水平的葡萄糖和少量的怀孕将减少患糖尿病的机会。
Recommendation
建议
a. Always do Cardio at least 20 mins per day to reduce the Glucose level
一个。 每天至少要做20分钟有氧运动以降低葡萄糖水平
b. Eat bitter leafs and reduce the intakes of sweet things like snacks
b。 吃苦树叶,减少零食等甜食的摄入
c. Do Child Control and use condoms if you do not wish to get pregnant
C。 如果您不想怀孕,请进行儿童控制和使用避孕套
d. Tell your Husband he don do nah you wan kill me :)
d。 告诉你的丈夫, he don do nah you wan kill me :)
This was put together as part of effort to explain black box machine learning models, feel free to reach me on Twitter.
这是解释黑匣子机器学习模型的一部分,请随时与我联系 。
Special Thanks to Yabebal, 10Academy Team and Babatunde. The complete notebook can be found here
特别感谢Yabebal,10 学院团队和Babatunde。 完整的笔记本可以在这里找到
翻译自: https://medium.com/swlh/machine-learning-model-explanation-9f238d8bfe25
机器学习模型 非线性模型