使用Docker安装ELK(Elasticsearch+Logstash+Kibana)+filebeat____基于CentOS7.9
目录
一、安装JDK
二、部署Elasticsearch
三、部署kibana
四、部署Logstash
五、部署filebeat
六、filebeat采集数据,logstash过滤,在kibana中显示
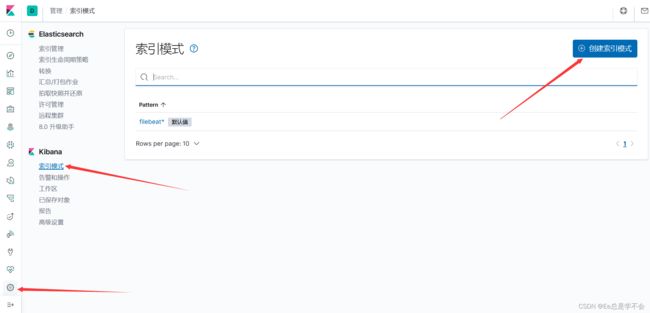
七、kibana增加索引
PS:本文中,ip为部署服务器的IP地址,esip为es容器的通讯ip地址。
一、安装JDK
1、更新系统
sudo yum update2、安装Java
下面是安装OpenJDK的命令:
sudo yum install java-1.8.0-openjdk3、验证安装
java -version二、部署Elasticsearch
1、查看是否安装docker
docker version
Client: Docker Engine - Community
 Version:           24.0.5
 API version:       1.43
 Go version:        go1.20.6
 Git commit:        ced0996
 Built:             Fri Jul 21 20:39:02 2023
 OS/Arch:           linux/amd64
 Context:           default

Server: Docker Engine - Community
 Engine:
  Version:          24.0.5
  API version:      1.43 (minimum version 1.12)
  Go version:       go1.20.6
  Git commit:       a61e2b4
  Built:            Fri Jul 21 20:38:05 2023
  OS/Arch:          linux/amd64
  Experimental:     false
 containerd:
  Version:          1.6.21
  GitCommit:        3dce8eb055cbb6872793272b4f20ed16117344f8
 runc:
  Version:          1.1.7
  GitCommit:        v1.1.7-0-g860f061
 docker-init:
  Version:          0.19.0
  GitCommit:        de40ad0
安装最新版的docker可能导致部分系统不兼容,可以安装早些的版本。
2、查找并安装elasticsearch镜像
查找:
docker search elasticsearch
NAME                                     DESCRIPTION                                     STARS     OFFICIAL   AUTOMATED
elasticsearch                            Elasticsearch is a powerful open source sear…   6122      [OK]
kibana                                   Kibana gives shape to any kind of data — str…   2626      [OK]
bitnami/elasticsearch                    Bitnami Docker Image for Elasticsearch          67                   [OK]
bitnami/elasticsearch-exporter           Bitnami Elasticsearch Exporter Docker Image     7                    [OK]
rancher/elasticsearch-conf                                                               2
rapidfort/elasticsearch                  RapidFort optimized, hardened image for Elas…   10
bitnami/elasticsearch-curator-archived   A copy of the container images of the deprec…   0
rapidfort/elasticsearch-official         RapidFort optimized, hardened image for Elas…   0
bitnamicharts/elasticsearch                                                              0
onlyoffice/elasticsearch                                                                 1
rancher/elasticsearch                                                                    1
couchbase/elasticsearch-connector        Couchbase Elasticsearch Connector               0
rancher/elasticsearch-bootstrap                                                          1
dtagdevsec/elasticsearch                 T-Pot Elasticsearch                             4                    [OK]
corpusops/elasticsearch                  https://github.com/corpusops/docker-images/     0
vulhub/elasticsearch                                                                     0
uselagoon/elasticsearch-7                                                                0
securecodebox/elasticsearch                                                              0
eucm/elasticsearch                       Elasticsearch 1.7.5 Docker Image                1                    [OK]
ilios/elasticsearch                                                                      0
uselagoon/elasticsearch-6                                                                0
openup/elasticsearch-0.90                                                                0
litmuschaos/elasticsearch-stress                                                         0
drud/elasticsearch_exporter                                                              0
geekzone/elasticsearch-curator                                                           0
安装:
docker pull elasticsearch:7.7.1
7.7.1: Pulling from library/elasticsearch
524b0c1e57f8: Pull complete
4f79045bc94a: Pull complete
4602c5830f92: Pull complete
10ef2eb1c9b1: Pull complete
47fca9194a1b: Pull complete
c282e1371ecc: Pull complete
302e1effd34b: Pull complete
50acbec75309: Pull complete
f89bc5c60b5f: Pull complete
Digest: sha256:dff614393a31b93e8bbe9f8d1a77be041da37eac2a7a9567166dd5a2abab7c67
Status: Downloaded newer image for elasticsearch:7.7.1
docker.io/library/elasticsearch:7.7.1
3、查看已安装的docker镜像
docker images
REPOSITORY                                                        TAG       IMAGE ID       CREATED       SIZE
elasticsearch                                                     7.7.1     830a894845e3   3 years ago   804MB
k8s.gcr.io/kube-proxy                                             v1.17.4   6dec7cfde1e5   3 years ago   116MB
registry.aliyuncs.com/google_containers/kube-proxy                v1.17.4   6dec7cfde1e5   3 years ago   116MB
registry.aliyuncs.com/google_containers/kube-apiserver            v1.17.4   2e1ba57fe95a   3 years ago   171MB
k8s.gcr.io/kube-apiserver                                         v1.17.4   2e1ba57fe95a   3 years ago   171MB
k8s.gcr.io/kube-controller-manager                                v1.17.4   7f997fcf3e94   3 years ago   161MB
registry.aliyuncs.com/google_containers/kube-controller-manager   v1.17.4   7f997fcf3e94   3 years ago   161MB
registry.aliyuncs.com/google_containers/kube-scheduler            v1.17.4   5db16c1c7aff   3 years ago   94.4MB
k8s.gcr.io/kube-scheduler                                         v1.17.4   5db16c1c7aff   3 years ago   94.4MB
k8s.gcr.io/coredns                                                1.6.5     70f311871ae1   3 years ago   41.6MB
k8s.gcr.io/etcd                                                   3.4.3-0   303ce5db0e90   3 years ago   288MB
registry.aliyuncs.com/google_containers/etcd                      3.4.3-0   303ce5db0e90   3 years ago   288MB
k8s.gcr.io/pause                                                  3.1       da86e6ba6ca1   5 years ago   742kB
registry.aliyuncs.com/google_containers/pause                     3.1       da86e6ba6ca1   5 years ago   742kB
kubeguide/hadoop                                                  latest    e0af06208032   6 years ago   830MB
4、创建挂载目录
[root@ceph-node4 ~]# mkdir -p /data/elk/es/{config,data,logs}
5、授权
docker中elasticsearch的用户UID是1000.
[root@ceph-node4 ~]# chown -R 1000:1000 /data/elk/es
6、创建挂载配置文件
cd /data/elk/es/config
touch elasticsearch.yml
vi elasticsearch.yml
#[elasticsearch.yml]
cluster.name: "my-es"
network.host: 0.0.0.0
http.port: 92007、运行elasticsearch
通过镜像,启动一个容器,并将9200和9300端口映射到本机(elasticsearch的默认端口是9200,我们把宿主环境9200端口映射到Docker容器中的9200端口)。
docker run -it -d -p 9200:9200 -p 9300:9300 --name es -e ES_JAVA_OPTS="-Xms1g -Xmx1g" -e "discovery.type=single-node" --restart=always -v /data/elk/es/config/elasticsearch.yml:/usr/share/elasticsearch/config/elasticsearch.yml -v /data/elk/es/data:/usr/share/elasticsearch/data -v /data/elk/es/logs:/usr/share/elasticsearch/logs elasticsearch:7.7.19e70d30eaa571c6a54572d5babb14e688220494ca039b292d0cb62a54a982ebb
8、验证安装是否成功
curl http://localhost:9200
{
  "name" : "9e70d30eaa57",
  "cluster_name" : "my-es",
  "cluster_uuid" : "nWsyXGd1RtGATFs4itJ4nQ",
  "version" : {
    "number" : "7.7.1",
    "build_flavor" : "default",
    "build_type" : "docker",
    "build_hash" : "ad56dce891c901a492bb1ee393f12dfff473a423",
    "build_date" : "2020-05-28T16:30:01.040088Z",
    "build_snapshot" : false,
    "lucene_version" : "8.5.1",
    "minimum_wire_compatibility_version" : "6.8.0",
    "minimum_index_compatibility_version" : "6.0.0-beta1"
  },
  "tagline" : "You Know, for Search"
}
三、部署kibana
1、安装kibana
docker pull kibana:7.7.17.7.1: Pulling from library/kibana
524b0c1e57f8: Already exists
103dc10f20b6: Pull complete
e397e023efd5: Pull complete
f0ee6620405c: Pull complete
17e4e03944f0: Pull complete
eff8f4cc3749: Pull complete
fa92cc28ed7e: Pull complete
afda7e77e6ed: Pull complete
019e109bb7c5: Pull complete
e82949888e47: Pull complete
15f31b4d9a52: Pull complete
Digest: sha256:ea0eab16b0330e6b3d9083e3c8fd6e82964fc9659989a75ecda782fbd160fdaa
Status: Downloaded newer image for kibana:7.7.1
docker.io/library/kibana:7.7.12、查看是否完成
docker images3、获取elasticsearch容器esip
docker inspect --format '{{ .NetworkSettings.IPAddress }}' es
172.17.0.2
这里的esip是容器内部通信的ip,而不是连接外部网络的ip。
查看IP
docker inspect elasticsearch |grep IPAddress查看es状态和详细esip:
docker inspect es"IPAddress": "172.20.0.2"4、修改配置文件
创建文件夹、生成yml文件并且赋予读写权限。
sudo mkdir -p /data/elk/kibana
sudo touch /data/elk/kibana/kibana.yml
sudo chmod +w /data/elk/kibana/kibana.yml
编辑配置文件:
vi /data/elk/kibana/kibana.yml#[kibana.yml]
#Default Kibana configuration for docker target
server.name: kibana
server.host: "0"
elasticsearch.hosts: ["http://172.17.0.2:9200"]
xpack.monitoring.ui.container.elasticsearch.enabled: true
此处的es.hosts即为http://esip:9200
5、运行kibana
docker run -d --restart=always --log-driver json-file --log-opt max-size=100m --log-opt max-file=2 --name kibana -p 5601:5601 -v /data/elk/kibana/kibana.yml:/usr/share/kibana/config/kibana.yml kibana:7.7.1
87b91be986938ad581fb79354bd41895eb874ce74b0688ed6e46396691e040a4
查看状态:
docker ps | grep kibanadocker ps若要停止并删除Kibana容器:
docker stop kibana
docker rm kibana6、访问UI界面
浏览器上输入:http://ip:5601
若无法访问UI界面:
1、检查kibana容器配置文件
将配置文件中elasticsearch.hosts地址修改为elasticsearch容器地址。
docker exec -it kibana /bin/bash
vi config/kibana.yml
#[kibana.yml]
#Default Kibana configuration for docker target
server.name: kibana
server.host: "0"
elasticsearch.hosts: ["http://172.17.0.2:9200"]
xpack.monitoring.ui.container.elasticsearch.enabled: true
确保此处的配置与刚刚设置的相同,尤其注意esip,因为是随机分配的,每次重启服务器,所分配的esip可能都不一样。
2、重启kibana
docker restart kibanakibana
3、查看docker容器运行情况
docker ps
查看kibana日志
docker logs kibana4、重新访问http://ip:5601
若启动较慢,可多刷新几次。
中文设置:
Kibana 的配置文件 kibana.yml 文件应该在 /data/elk/kibana/kibana.yml 路径下
要将 i18n.locale 配置为 zh-CN,打开 /data/elk/kibana/kibana.yml 文件,找到末尾并添加以下行:
i18n.locale: "zh-CN"然后,重启 Kibana 容器以使更改生效。可以使用以下命令重启 Kibana 容器:
docker restart kibana最后,再打开网页UI界面,就可以看到汉化了。
四、部署Logstash
1、获取logstash镜像
docker pull logstash:7.7.1
7.7.1: Pulling from library/logstash
524b0c1e57f8: Already exists
1a7635b4d6e8: Pull complete
92c26c13a43f: Pull complete
189edda23928: Pull complete
4b71f12aa7b2: Pull complete
8eae4815fe1e: Pull complete
4c2df663cec5: Pull complete
bc06e285e821: Pull complete
2fadaff2f68a: Pull complete
89a9ec66a044: Pull complete
724600a30902: Pull complete
Digest: sha256:cf2a17d96e76e5c7a04d85d0f2e408a0466481b39f441e9d6d0aad652e033026
Status: Downloaded newer image for logstash:7.7.1
docker.io/library/logstash:7.7.1
2、编辑logstash.yml配置文件。所使用目录需对应新增。
mkdir /data/elk/logstash/
touch /data/elk/logstash/logstash.yml
vi /data/elk/logstash/logstash.yml
#[logstash.yml]
http.host: "0.0.0.0"
xpack.monitoring.elasticsearch.hosts: [ "http://172.17.0.2:9200" ]
xpack.monitoring.elasticsearch.username: elastic
xpack.monitoring.elasticsearch.password: changeme
#path.config: /data/elk/logstash/conf.d/*.conf
path.config: /data/docker/logstash/conf.d/*.conf
path.logs: /var/log/logstash
此处的es.hosts也是esip
3、编辑logstash.conf文件,此处先配置logstash直接采集本地数据发送至es
mkdir /data/elk/logstash/conf.d/
touch /data/elk/logstash/conf.d/syslog.conf
vi /data/elk/logstash/conf.d/syslog.conf
cat /data/elk/logstash/conf.d/syslog.conf
#[syslog.conf]
input {
  syslog {
    type => "system-syslog"
    port => 5044
  }
}
output {
  elasticsearch {
    hosts => ["ip:9200"]
    index => "system-syslog-%{+YYYY.MM}"
  }
}
此处的ip为挂载容器的服务器的ip地址
4、编辑本地rsyslog配置增加:
vi /etc/rsyslog.conf
*.* @@ip:5044此处的ip为挂载容器的服务器的ip地址
5、配置修改后重启服务
systemctl restart rsyslog
6、运行logstash
docker run -d --restart=always --log-driver json-file --log-opt max-size=100m --log-opt max-file=2 -p 5044:5044 --name logstash -v /data/elk/logstash/logstash.yml:/usr/share/logstash/config/logstash.yml -v /data/elk/logstash/conf.d/:/data/docker/logstash/conf.d/ logstash:7.7.1
7、测试es接收logstash数据
curl http://localhost:9200/_cat/indices?v
health status index                    uuid                   pri rep docs.count docs.deleted store.size pri.store.size
green  open   .apm-custom-link         SUOJEG0hRlCrQ2cQUr1S7g   1   0          0            0       208b           208b
green  open   .kibana_task_manager_1   c7ZI_gS_T1GbFrlOMlB4bw   1   0          5            0     54.9kb         54.9kb
green  open   .apm-agent-configuration f684gzXURZK6Q13GPGZIhg   1   0          0            0       208b           208b
green  open   .kibana_1                xtNccoc-Ru2zSoXJe8AA1Q   1   0         36            2     55.8kb         55.8kb
yellow open   system-syslog-2023.07    AUPeJ5I8R6-iWkdeTTJuAw   1   1         29            0     60.9kb         60.9kb
获取到system-syslog-相关日志,则es已能获取来自logstash的数据,kibana中也同步显示数据。
五、部署filebeat
1、在需要监测的机器yum安装filebeat
wget https://artifacts.elastic.co/downloads/beats/filebeat/filebeat-7.7.1-x86_64.rpm
yum install filebeat-7.7.1-x86_64.rpm
2、filebeat配置,此处先配置filebeat直接发送数据到es
vim /etc/filebeat/filebeat.yml#=========================== Filebeat inputs =============================
filebeat.inputs:
- type: log
enabled: true
paths:
- /var/log/ceph/*.log
- /var/log/messages
完整版filbeat.yml(最新)Ceph版本
cat /etc/filebeat/filebeat.yml
###################### Filebeat Configuration Example #########################

# This file is an example configuration file highlighting only the most common
# options. The filebeat.reference.yml file from the same directory contains all the
# supported options with more comments. You can use it as a reference.
#
# You can find the full configuration reference here:
# https://www.elastic.co/guide/en/beats/filebeat/index.html

# For more available modules and options, please see the filebeat.reference.yml sample
# configuration file.

#=========================== Filebeat inputs =============================

filebeat.inputs:

# Each - is an input. Most options can be set at the input level, so
# you can use different inputs for various configurations.
# Below are the input specific configurations.

- type: log

  # Change to true to enable this input configuration.
  enabled: true

  # Paths that should be crawled and fetched. Glob based paths.
  paths:
    - /var/log/ceph/*.log
    #- c:\programdata\elasticsearch\logs\*
  fields:
    log_type: ceph
  # Exclude lines. A list of regular expressions to match. It drops the lines that are
  # matching any regular expression from the list.
  #exclude_lines: ['^DBG']

  # Include lines. A list of regular expressions to match. It exports the lines that are
  # matching any regular expression from the list.
  #include_lines: ['^ERR', '^WARN']

  # Exclude files. A list of regular expressions to match. Filebeat drops the files that
  # are matching any regular expression from the list. By default, no files are dropped.
  #exclude_files: ['.gz$']

  # Optional additional fields. These fields can be freely picked
  # to add additional information to the crawled log files for filtering
  #fields:
  #  level: debug
  #  review: 1

  ### Multiline options

  # Multiline can be used for log messages spanning multiple lines. This is common
  # for Java Stack Traces or C-Line Continuation

  # The regexp Pattern that has to be matched. The example pattern matches all lines starting with [
  #multiline.pattern: ^\[

  # Defines if the pattern set under pattern should be negated or not. Default is false.
  #multiline.negate: false

  # Match can be set to "after" or "before". It is used to define if lines should be append to a pattern
  # that was (not) matched before or after or as long as a pattern is not matched based on negate.
  # Note: After is the equivalent to previous and before is the equivalent to to next in Logstash
  #multiline.match: after


#============================= Filebeat modules ===============================

filebeat.config.modules:
  # Glob pattern for configuration loading
  path: ${path.config}/modules.d/*.yml

  # Set to true to enable config reloading
  reload.enabled: false

  # Period on which files under path should be checked for changes
  #reload.period: 10s

#==================== Elasticsearch template setting ==========================

setup.template.settings:
  index.number_of_shards: 1
  #index.codec: best_compression
  #_source.enabled: false

#================================ General =====================================

# The name of the shipper that publishes the network data. It can be used to group
# all the transactions sent by a single shipper in the web interface.
#name:

# The tags of the shipper are included in their own field with each
# transaction published.
#tags: ["service-X", "web-tier"]

# Optional fields that you can specify to add additional information to the
# output.
#fields:
#  env: staging


#============================== Dashboards =====================================
# These settings control loading the sample dashboards to the Kibana index. Loading
# the dashboards is disabled by default and can be enabled either by setting the
# options here or by using the `setup` command.
#setup.dashboards.enabled: false

# The URL from where to download the dashboards archive. By default this URL
# has a value which is computed based on the Beat name and version. For released
# versions, this URL points to the dashboard archive on the artifacts.elastic.co
# website.
#setup.dashboards.url:

#============================== Kibana =====================================

# Starting with Beats version 6.0.0, the dashboards are loaded via the Kibana API.
# This requires a Kibana endpoint configuration.
setup.kibana:

  # Kibana Host
  # Scheme and port can be left out and will be set to the default (http and 5601)
  # In case you specify and additional path, the scheme is required: http://localhost:5601/path
  # IPv6 addresses should always be defined as: https://[2001:db8::1]:5601
  #host: "localhost:5601"

  # Kibana Space ID
  # ID of the Kibana Space into which the dashboards should be loaded. By default,
  # the Default Space will be used.
  #space.id:

#============================= Elastic Cloud ==================================

# These settings simplify using Filebeat with the Elastic Cloud (https://cloud.elastic.co/).

# The cloud.id setting overwrites the `output.elasticsearch.hosts` and
# `setup.kibana.host` options.
# You can find the `cloud.id` in the Elastic Cloud web UI.
#cloud.id:

# The cloud.auth setting overwrites the `output.elasticsearch.username` and
# `output.elasticsearch.password` settings. The format is `:`.
#cloud.auth:

#================================ Outputs =====================================

# Configure what output to use when sending the data collected by the beat.

#-------------------------- Elasticsearch output ------------------------------
#output.elasticsearch:
  # Array of hosts to connect to.
  #hosts: ["ip:9200"]

  # Protocol - either `http` (default) or `https`.
  #protocol: "https"

  # Authentication credentials - either API key or username/password.
  #api_key: "id:api_key"
  #username: "elastic"
  #password: "changeme"

#----------------------------- Logstash output --------------------------------
output.logstash:
  # The Logstash hosts
  hosts: ["ip:5044"]

  # Optional SSL. By default is off.
  # List of root certificates for HTTPS server verifications
  #ssl.certificate_authorities: ["/etc/pki/root/ca.pem"]

  # Certificate for SSL client authentication
  #ssl.certificate: "/etc/pki/client/cert.pem"

  # Client Certificate Key
  #ssl.key: "/etc/pki/client/cert.key"

#================================ Processors =====================================

# Configure processors to enhance or manipulate events generated by the beat.

processors:
  - add_host_metadata: ~
  - add_cloud_metadata: ~
  - add_docker_metadata: ~
  - add_kubernetes_metadata: ~

#================================ Logging =====================================

# Sets log level. The default log level is info.
# Available log levels are: error, warning, info, debug
#logging.level: debug

# At debug level, you can selectively enable logging only for some components.
# To enable all selectors use ["*"]. Examples of other selectors are "beat",
# "publish", "service".
#logging.selectors: ["*"]

#============================== X-Pack Monitoring ===============================
# filebeat can export internal metrics to a central Elasticsearch monitoring
# cluster.  This requires xpack monitoring to be enabled in Elasticsearch.  The
# reporting is disabled by default.

# Set to true to enable the monitoring reporter.
#monitoring.enabled: false

# Sets the UUID of the Elasticsearch cluster under which monitoring data for this
# Filebeat instance will appear in the Stack Monitoring UI. If output.elasticsearch
# is enabled, the UUID is derived from the Elasticsearch cluster referenced by output.elasticsearch.
#monitoring.cluster_uuid:

# Uncomment to send the metrics to Elasticsearch. Most settings from the
# Elasticsearch output are accepted here as well.
# Note that the settings should point to your Elasticsearch *monitoring* cluster.
# Any setting that is not set is automatically inherited from the Elasticsearch
# output configuration, so if you have the Elasticsearch output configured such
# that it is pointing to your Elasticsearch monitoring cluster, you can simply
# uncomment the following line.
#monitoring.elasticsearch:

#================================= Migration ==================================

# This allows to enable 6.7 migration aliases
#migration.6_to_7.enabled: true
3、启动服务
[root@ceph-node3 ~]# systemctl restart filebeat.service4、es接收数据查询
curl http://localhost:9200/_cat/indices?v
health status index                            uuid                   pri rep docs.count docs.deleted store.size pri.store.size
green  open   .apm-custom-link                 SUOJEG0hRlCrQ2cQUr1S7g   1   0          0            0       208b           208b
green  open   .kibana_task_manager_1           c7ZI_gS_T1GbFrlOMlB4bw   1   0          5            0     54.9kb         54.9kb
green  open   .apm-agent-configuration         f684gzXURZK6Q13GPGZIhg   1   0          0            0       208b           208b
yellow open   filebeat-7.7.1-2023.07.28-000001 38f_nqi_TdWXDRbXdTV0ng   1   1      75872            0     19.8mb         19.8mb
green  open   .kibana_1                        xtNccoc-Ru2zSoXJe8AA1Q   1   0         39            2     70.3kb         70.3kb
yellow open   system-syslog-2023.07            AUPeJ5I8R6-iWkdeTTJuAw   1   1         31            0    111.5kb        111.5kb
可查到filebeat-7.7.1-*数据,kibana中也显示对应数据。
六、filebeat采集数据,logstash过滤,在kibana中显示
1、删除之前的logstash生成的测试数据
curl -XDELETE http://localhost:9200/system-syslog-2023.07
{"acknowledged":true}2、修改filebeat.yml,后重启服务
vim /etc/filebeat/filebeat.yml
cat /etc/filebeat/filebeat.yml
#-------------------------- Elasticsearch output ------------------------------
#output.elasticsearch:
# Array of hosts to connect to.
#hosts: ["localhost:9200"]
# Protocol - either `http` (default) or `https`.
#protocol: "https"
# Authentication credentials - either API key or username/password.
#api_key: "id:api_key"
#username: "elastic"
#password: "changeme"
#----------------------------- Logstash output --------------------------------
output.logstash:
# The Logstash hosts
hosts: ["ip:5044"]
# Optional SSL. By default is off.
# List of root certificates for HTTPS server verifications
#ssl.certificate_authorities: ["/etc/pki/root/ca.pem"]
# Certificate for SSL client authentication
#ssl.certificate: "/etc/pki/client/cert.pem"
# Client Certificate Key
#ssl.key: "/etc/pki/client/cert.key"
后重启服务
systemctl restart filebeat.service
3、修改lostash.conf配置
touch /data/elk/logstash/conf.d/logstash.conf
vi /data/elk/logstash/conf.d/logstash.conf
cat /data/elk/logstash/conf.d/logstash.conf
input {
  beats {
    port => 5044
  }
}
output {
  elasticsearch {
    hosts => ["172.17.0.2:9200"]
    index => "filebeat_g-%{+YYYY.MM.dd}"
  }
}
4、查看es是否获取数据
curl http://localhost:9200/_cat/indices?v
health status index                            uuid                   pri rep docs.count docs.deleted store.size pri.store.size
green  open   .apm-custom-link                 SUOJEG0hRlCrQ2cQUr1S7g   1   0          0            0       208b           208b
green  open   .kibana_task_manager_1           c7ZI_gS_T1GbFrlOMlB4bw   1   0          5            0     54.9kb         54.9kb
green  open   .apm-agent-configuration         f684gzXURZK6Q13GPGZIhg   1   0          0            0       208b           208b
yellow open   filebeat-7.7.1-2023.07.28-000001 38f_nqi_TdWXDRbXdTV0ng   1   1      76257            0     19.9mb         19.9mb
green  open   .kibana_1                        xtNccoc-Ru2zSoXJe8AA1Q   1   0         39            2     70.3kb         70.3kb
yellow open   system-syslog-2023.07            -sFCBdQJTx62qc6omgKEiA   1   1         25            0      291kb          291kb
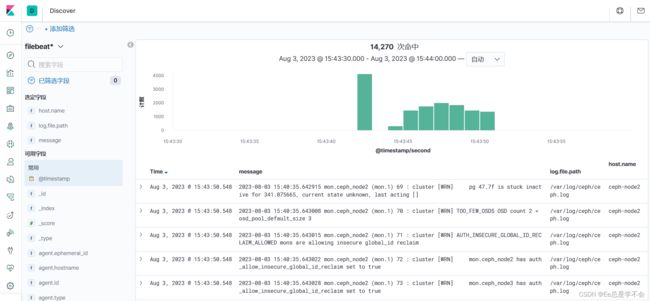
filebeat_g-*数据已经获取,kibana中增加相关索引即可。
七、kibana增加索引并观测系统状态