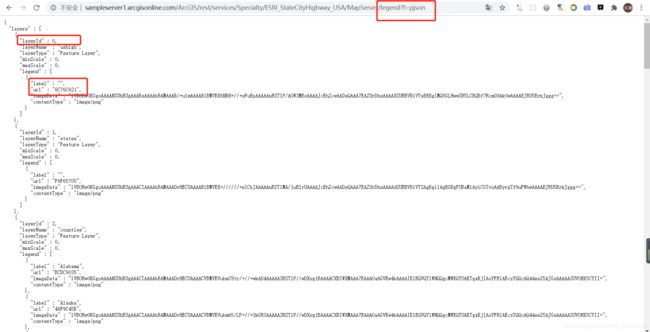
获取arcgis server 发布的WMS服务的图例,然后将图例在echart中显示
实现思路:
WMS中legend是img格式,并且echart支持将图片作为图例样式可视化展示,所以获取WMS图例的img再加载到echart。
1、如下是WMS服务地址:http://sampleserver1.arcgisonline.com/ArcGIS/rest/services/Specialty/ESRI_StateCityHighway_USA/MapServer
 3、在WMS服务json文件中,layerId和url确定图例img的路径,可以获取图片如下
4、将图例img加载到echart中,将legend中data的icon改为图片路径即可,格式:“image://图片路径”
let name1 = ["大牛", "二牛", "三牛"];
      let value = [500, 200, 100];
      let chartData = [];
      for (var land in name1) {
        chartData.push({
          value: value[land],
          name: name1[land],
        });
      }
      var myChart = echarts.init(document.getElementById("main"));
      myChart.setOption({
        tooltip: {
          trigger: "item",
          formatter: "{a}
{b}: {c} ({d}%)",
        },
        color: ["#4472C5", "#ED7C30", "#fff"],

        legend: {
          orient: "horizontal", //horizontal vertical
          icon: "rect",
          x: "right",
          y: "bottom",
          textStyle: {
            //图例文字的样式
            color: "#0b2b5e",
            fontSize: 16,
          },
          // data: name1,
          borderColor: "#000",
          borderWidth: 2,
          data: [
            {
              name: "大牛",
            },
            {
              name: "二牛",
            },
            {
              name: "三牛",
              icon:
                "image://http://sampleserver1.arcgisonline.com/ArcGIS/rest/services/Specialty/ESRI_StateCityHighway_USA/MapServer/2/images/3D84D80",
            },
          ],
        },
        series: [
          {
            name: "访问来源",
            type: "pie",
            radius: ["30%", "70%"],
            // radius: '70%',
            center: ["50%", "40%"],
            avoidLabelOverlap: false,
            label: {
              normal: {
                show: false,
                position: "center",
              },
              emphasis: {
                show: true,
                textStyle: {
                  fontSize: "30",
                  fontWeight: "bold",
                },
              },
            },
            labelLine: {
              normal: {
                show: true,
              },
            },
            data: chartData,
          },
        ],
      });
5、效果如下:


