echarts 简单渐变折线图
渐变颜色多个折线图
import * as echarts from 'echarts/core' // 看个人项目echart引入方式
options: {
  tooltip: {
    trigger: 'axis'
  },
  yAxis: {
    type: 'value',
    name: '能耗:标准煤kg'
  },
  legend: {
    icon: 'circle',
    itemHeight: 8,
    itemWidth: 8,
    top: '1%',
    left: 'center'
    // selectedMode: 'single' //只显示一个
  },
  grid: {
    top: '20%',
    left: '5%',
    right: '2%',
    bottom: '3%',
    containLabel: true
  },
  animationDuration: 3000,
  xAxis: {
    type: 'category',
    data: []
  },
  series: [
    {
      data: [],
      type: 'line',
      smooth: true,
      name: '用电量',
      color: '#FAAD14',
      areaStyle: {
        color: new echarts.graphic.LinearGradient(
          0,
          0,
          0,
          1,
          [
            { offset: 0, color: '#FAAD14' },
            { offset: 0.6, color: '#FAAD1470' },
            { offset: 1, color: '#FAAD1410' }
          ],
          false
        )
      }
    },
    {
      data: [],
      type: 'line',
      smooth: true,
      name: '用水量',
      color: '#2B98F7',
      areaStyle: {
        color: new echarts.graphic.LinearGradient(
          0,
          0,
          0,
          1,
          [
            { offset: 0, color: '#2B98F7' },
            { offset: 0.6, color: '#2B98F770' },
            { offset: 1, color: '#2B98F710' }
          ],
          false
        )
      }
    },
    {
      data: [],
      type: 'line',
      smooth: true,
      name: '用气量',
      color: '#FF2F2F',
      areaStyle: {
        color: new echarts.graphic.LinearGradient(
          0,
          0,
          0,
          1,
          [
            { offset: 0, color: '#FF2F2F' },
            { offset: 0.6, color: '#FF2F2F70' },
            { offset: 1, color: '#FF2F2F10' }
          ],
          false
        )
      }
    }
  ]
}
动态数据多个
eslint校验下数据使用
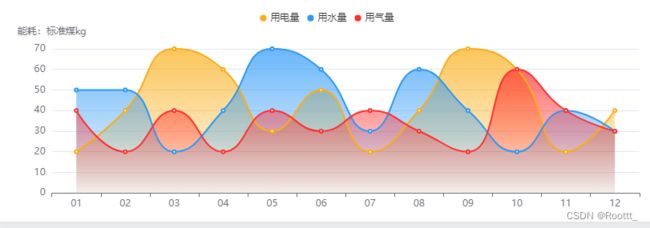
options!.xAxis!['data'] = [
    '01',
    '02',
    '03',
    '04',
    '05',
    '06',
    '07',
    '08',
    '09',
    '10',
    '11',
    '12'
]
options!.series![0].data = [20, 40, 70, 60, 30, 50, 20, 40, 70, 60, 20, 40]
options!.series![1].data = [50, 50, 20, 40, 70, 60, 30, 60, 40, 20, 40, 30]
options!.series![2].data = [40, 20, 40, 20, 40, 30, 40, 30, 20, 60, 40, 30]
// let arr = [
  //   { name: '用电量', value: [20, 40, 70, 60, 30, 50, 20, 40, 70, 60, 20, 40], color: '#FAAD14' },
  //   { name: '用水量', value: [50, 20, 40, 70, 60, 30, 20, 40, 70, 60, 20, 40], color: '#2B98F7' },
  //   { name: '用气量', value: [40, 60, 30, 50, 20, 70, 70, 40, 70, 60, 20, 40], color: '#FF2F2F' }
  // ]
  // let series: any = []
  // for (let item of arr) {
  //   series.push({
  //     data: item.value,
  //     type: 'line',
  //     smooth: true,
  //     name: item.name,
  //     color: item.color,
  //     areaStyle: {
  //       color: new echarts.graphic.LinearGradient(
  //         0,
  //         0,
  //         0,
  //         1,
  //         [
  //           { offset: 0, color: item.color },
  //           { offset: 0.6, color: item.color + '70' },
  //           { offset: 1, color: item.color + '10' }
  //         ],
  //         false
  //       )
  //     }
  //   })
  // }
  // options!.series = series