【Antv G2】AntV G2自定义tooltip,想给tooltip加个单位?代码亲测有效
AntV G2自定义tooltip
- 业务场景
- 实现思路
- Demo
业务场景
使用AntV G2做开发的时候,可能会遇到要自定义tooltip的情况。

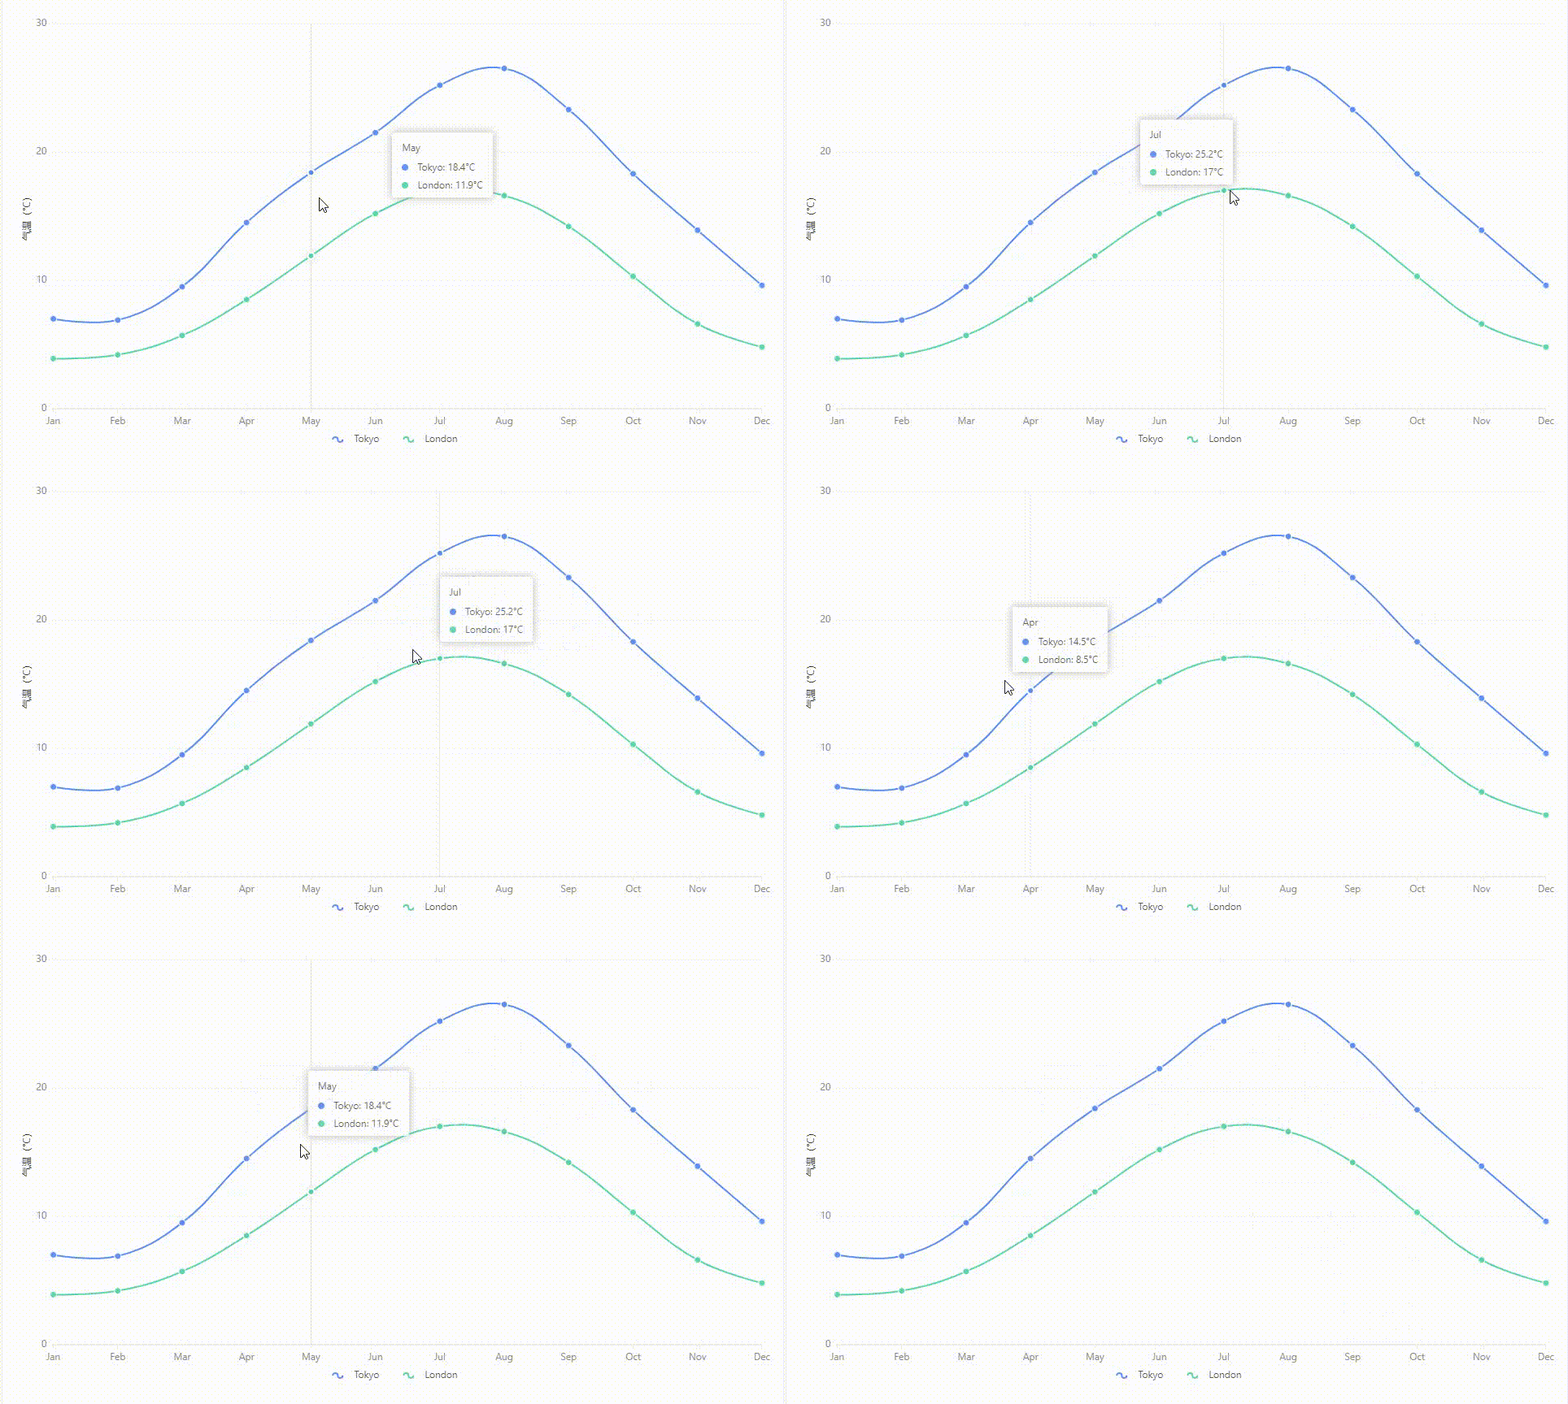
经过查阅文档和调试代码后,最终能实现下面的效果:tooltip可以为单项数据加单位,纵坐标统一显示单位。

实现思路
- 参考官网Tooltip配置-内容配置部分,对于 tooltip 显示内容的定制,我们需要使用 geometry.tooltip() 接口,同时还可以同 chart.tooltip({ itemTpl: ‘xxx’}) 配合使用。
- 鉴于官方文档对于一些刚开始用AntV的同学而言,可能会有些疑惑。因此,我通过改造G2的官网的图表示例-折线图-基础折线图-气温图来详细分析下实现思路:
// author by Emily酱 from CSDN
chart.tooltip({
  showCrosshairs: true,
  shared: true,
  itemTpl: `


    {name}: {value}

    ` // 这里的{name}和{value}就是下面.tooltip中return的name和value
});
chart.line()
  .position('month*temperature') // 数据源(一个数组)中每个元素(一个对象)的month属性和temperature属性交会画出来的折线
  .color('city') // 有多少条折线由city属性来定
  .shape('smooth')
  .tooltip('month*temperature*city', function (month,temperature,city) { // tooltip的第一个参数写上需要显示的字段'item1*item2*...';第二个参数为一个函数,该函数的参数为需要显示的字段。
    return {
      name: city,
      value: temperature + '°C' // 这里也可以通过调用其他自定义函数的方式,去对数据进行更深层次的变换。但要注意this的指向问题!
    }
  })
Demo
下面的demo是基于G2的官网的图表示例-折线图-基础折线图-气温图进行改造的。添加了// add注释的为新增的代码行,添加了// edit注释的为修改的代码行供大家参考。
import { Chart } from '@antv/g2';

const data = [
  { month: 'Jan', city: 'Tokyo', temperature: 7 },
  { month: 'Jan', city: 'London', temperature: 3.9 },
  { month: 'Feb', city: 'Tokyo', temperature: 6.9 },
  { month: 'Feb', city: 'London', temperature: 4.2 },
  { month: 'Mar', city: 'Tokyo', temperature: 9.5 },
  { month: 'Mar', city: 'London', temperature: 5.7 },
  { month: 'Apr', city: 'Tokyo', temperature: 14.5 },
  { month: 'Apr', city: 'London', temperature: 8.5 },
  { month: 'May', city: 'Tokyo', temperature: 18.4 },
  { month: 'May', city: 'London', temperature: 11.9 },
  { month: 'Jun', city: 'Tokyo', temperature: 21.5 },
  { month: 'Jun', city: 'London', temperature: 15.2 },
  { month: 'Jul', city: 'Tokyo', temperature: 25.2 },
  { month: 'Jul', city: 'London', temperature: 17 },
  { month: 'Aug', city: 'Tokyo', temperature: 26.5 },
  { month: 'Aug', city: 'London', temperature: 16.6 },
  { month: 'Sep', city: 'Tokyo', temperature: 23.3 },
  { month: 'Sep', city: 'London', temperature: 14.2 },
  { month: 'Oct', city: 'Tokyo', temperature: 18.3 },
  { month: 'Oct', city: 'London', temperature: 10.3 },
  { month: 'Nov', city: 'Tokyo', temperature: 13.9 },
  { month: 'Nov', city: 'London', temperature: 6.6 },
  { month: 'Dec', city: 'Tokyo', temperature: 9.6 },
  { month: 'Dec', city: 'London', temperature: 4.8 },
];

const chart = new Chart({
  container: 'container',
  autoFit: true,
  height: 500,
});

chart.data(data);
chart.scale({
  month: {
    range: [0, 1],
  },
  temperature: {
    nice: true,
    alias: '气温(°C)', // add
  },
});

chart.tooltip({
  showCrosshairs: true,
  shared: true,
  itemTpl: `


    {name}: {value}

    ` // add
});

chart.axis('temperature', {
  label: {
    formatter: (val) => {
      return val; // edit
    },
  },
  title: {} // add
});

chart
  .line()
  .position('month*temperature')
  .color('city')
  .shape('smooth')
  .tooltip('month*temperature*city', function (month,temperature,city) {
    return {
      name: city,
      value: temperature + '°C'
    }
  }) // add

chart
  .point()
  .position('month*temperature')
  .color('city')
  .shape('circle');


chart.render();