echarts图表在uni-app中的使用
由于小程序包的限制,不适合直接引入echarts,而是定制下载,按需引入
使用方法
1.引入 npm install echarts mpvue-echarts
2.到官网在线定制下载所需要的echats.js文件,
3.新建common 文件夹,将定制文件放在common 中
4.将 node_modules 下 mpvue-echarts 中的 src 文件复制到components下
5.页面引入echarts.js 进行绘制
页面
<view class="charts-box2">
	<myChart id="main" ref="mapChart" :echarts="echarts" :onInit="initChart" />
</view>
引入echarts
引入组件,注册
import * as echarts from '@/common/echarts.min.js';
import myChart from '@/components/mpvue-echarts/src/echarts.vue';
export default {
components:{
myChart
},
data () {
return {
echarts:{},
}
},
methods: {
initChart(canvas, width, height) {
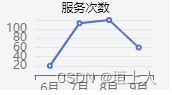
let yuefen = ['6月', '7月', '8月', '9月']
let shuju = [20,30,100,50]
let chart = null
chart = echarts.init(canvas, null, {
width: width,
height: height
});
var option = {
throttleTouch: true,
xAxis: {
type: 'category',
data: yuefen , // x 轴 ,此处替换动态数据
},
yAxis: {
type: 'value',
name: '标题'
// min: 0, // 刻度最小值
// max: 50, // 刻度最大值(需要动态获取最大值,并且能被3整除(向下取整再乘回来))
// splitNumber: 5, // 横线数
// interval: 10, // 刻度间隔
},
grid: {
left: 40
},
series: [{
data: shuju, // Y轴,此处替换动态数据
type: 'line',
nameTextStyle: {
width: 30
},
margin: 2,
formatter: function (value, index) {
if (value >= 100 && value < 1000) {
value = value / 1000 + "千";
} else if (value >= 1000) {
value = value / 1000 + "千";
}
return value;
}
}]
}; // ECharts 配置项
chart.setOption(option);
return chart; // 返回 chart 后可以自动绑定触摸操作
},
}
}
样式
这是一个折线图
x轴,y轴数据 动态替换即可
注:
报错
this.echarts.setCanvasCreator is not a function
修改 echarts.vue 页面中的几处
引入js
import * as echarts from '@/common/echarts.min.js';
onReady() {
this.echarts = echarts -------> 新增
if (!this.echarts) {
console.warn('组件需绑定 echarts 变量,例:
+ 'canvas-id="mychart-bar" :echarts="echarts"> ');
return;
}
if (!this.lazyLoad) this.init();
},
// const { canvasId } = this;
const canvasId = this.canvasId; -------> 修改
this.ctx = wx.createCanvasContext(canvasId,this); -------> 加this
const canvas = new WxCanvas(this.ctx, canvasId);
this.echarts.setCanvasCreator(() => canvas);
const query = wx.createSelectorQuery().in(this); -------> 修改