Python自动进行logistic回归并绘制关于OR的森林图
首先定义如下函数:
import pandas as pd
import statsmodels.formula.api as smf
import statsmodels.api as sm
from scipy.stats import norm
import numpy as np
from plotnine import *
"""因变量y必须是int:0或1"""
def logistic_regression(y,x,df):
    model = smf.glm(formula = f'{y} ~ {x}',
                    data = df,
                    family=sm.families.Binomial()).fit()
    print(model.summary(), end='\n\n\n')
    stat = pd.DataFrame({'p': model.pvalues, # series:每个β的p值
                         # 'beta': model.params, # series:β
                         # 'beta_lower_ci': model.conf_int().iloc[:, 0], #df:β的95%CI
                         # 'beta_upper_ci': model.conf_int().iloc[:, 1], #df:β的95%CI
                         'OR': np.exp(model.params), # series:OR
                         'OR_lower_ci': np.exp(model.params - norm.ppf(0.975)*model.bse),
                         'OR_upper_ci': np.exp(model.params + norm.ppf(0.975)*model.bse)})
    stat['sig'] = stat.apply(lambda x : "*" if x['p']<0.05 else "no_sig",axis=1)
    stat= stat.sort_values('OR', ascending=True)
    print(stat)
    """绘制森林图:OR"""
    forest_df = stat.drop("Intercept")\
                    .reset_index()\
                    .rename(columns={'index': 'independent_var'})\
                    .sort_values('OR', ascending=False)
    print(ggplot(forest_df , aes(y='independent_var', x='OR')) + # y轴(自变量x)为连续变量或二分类变量
          geom_point(aes(color='sig'),size=2) +
          geom_errorbarh(aes(xmin='OR_lower_ci',
                             xmax='OR_upper_ci',
                             color ='sig'), height=0.1) +
          scale_color_manual(values = ["red","black"]) +
          scale_y_discrete(limits= forest_df["independent_var"]) +
          guides(color=guide_legend(reverse=True))+
          labs(title='logistic Regression', x='OR', y='variable')+
          geom_vline(xintercept=1, linetype='dashed', color='black')+
          theme_minimal()+
          theme(plot_title=element_text(hjust=0.5)))
以上函数logistic_regression(y,x,df)单独放在logistic_regression.py文件中,参考http://t.csdn.cn/ovlRZ
即可实现统计自动化。
准备待分析数据集df:
    id  age  sex    group  T2DM  HBP  glucose
0    1   12    0     ctrl     0    0       15
1    2   40    0     ctrl     0    0       22
2    3   45    0     ctrl     0    0       24
3    4   67    0     ctrl     0    0       23
4    5   87    0     ctrl     1    0       26
5    6   65    0  disease     1    0       15
6    7   34    0  disease     1    0       23
7    8   67    0  disease     1    1       20
8    9   32    0  disease     1    1       19
9   10   59    0  disease     1    1       24
10  11   29    0  disease     1    1       23
11  12   48    0  disease     1    1       28
12  13   31    1  disease     0    1       22
13  14   32    1  disease     0    1       21
14  15   98    1  disease     0    1       24
15  16   99    1  disease     1    1       27
16  17  100    1  disease     1    1       28
17  18  101    1  disease     1    1       28
18  19  102    1  disease     0    1       30
19  20  103    1  disease     0    1       12
20  21  104    1    treat     0    1       13
21  22  105    1    treat     0    0       14
22  23  106    1    treat     0    0       15
23  24  107    1    treat     0    0       16
24  25  108    1    treat     0    0       17
25  26  109    1    treat     0    0       18
26  27  110    1    treat     0    0       19
27  28  111    1    treat     0    0       20
28  29  112    1    treat     1    0       21
29  30  113    1    treat     1    0       22
30  31  114    1    treat     1    1       23
31  32  115    1    treat     1    1       24
32  33  116    1    treat     1    1       25
33  34  117    1    treat     1    1       26
34  35  118    0    treat     0    1       27
35  36  119    0    treat     0    1       28
36  37  120    0    treat     0    1       29
37  38  121    0    treat     0    1       30
38  39  122    0    treat     0    1       31
39  40  123    0    treat     0    1       32
40  41  124    0    treat     0    0       33
41  42  125    0    treat     1    0       34
42  43  126    0    treat     1    0       35
43  44  127    0    treat     1    0       36
44  45  128    0    treat     1    0       37
其中
sex是二分类变量,取值为0(女性)、1(男性)
T2DM是二分类变量,取值为0(不是T2DM)、1(是T2DM)
HBP是二分类变量,取值为0(不是HBP)、1(是HBP)
group是三分类变量
连续变量有age、glucose
以T2DM为因变量,sex、HBP、age、glucose为自变量,进行logistic回归,并绘制关于OR的森林图:
logistic_regression(y="T2DM",x="sex+HBP+age+glucose",df=df)输出为:
                 Generalized Linear Model Regression Results
==============================================================================
Dep. Variable:                   T2DM   No. Observations:                   45
Model:                            GLM   Df Residuals:                       40
Model Family:                Binomial   Df Model:                            4
Link Function:                  Logit   Scale:                          1.0000
Method:                          IRLS   Log-Likelihood:                -28.334
Date:                Wed, 21 Jun 2023   Deviance:                       56.667
Time:                        15:07:31   Pearson chi2:                     44.3
No. Iterations:                     4   Pseudo R-squ. (CS):             0.1154
Covariance Type:            nonrobust
==============================================================================
                 coef    std err          z      P>|z|      [0.025      0.975]
------------------------------------------------------------------------------
Intercept     -2.7383      1.649     -1.661      0.097      -5.970       0.494
sex            0.6012      0.841      0.715      0.474      -1.046       2.249
HBP           -0.0543      0.675     -0.081      0.936      -1.377       1.268
age           -0.0155      0.012     -1.265      0.206      -0.039       0.008
glucose        0.1556      0.078      2.002      0.045       0.003       0.308
==============================================================================


                  p        OR  OR_lower_ci  OR_upper_ci     sig
Intercept  0.096803  0.064683     0.002554     1.638410  no_sig
HBP        0.935832  0.947133     0.252432     3.553680  no_sig
age        0.206003  0.984665     0.961363     1.008533  no_sig
glucose    0.045250  1.168346     1.003297     1.360547       *
sex        0.474470  1.824240     0.351258     9.474088  no_sig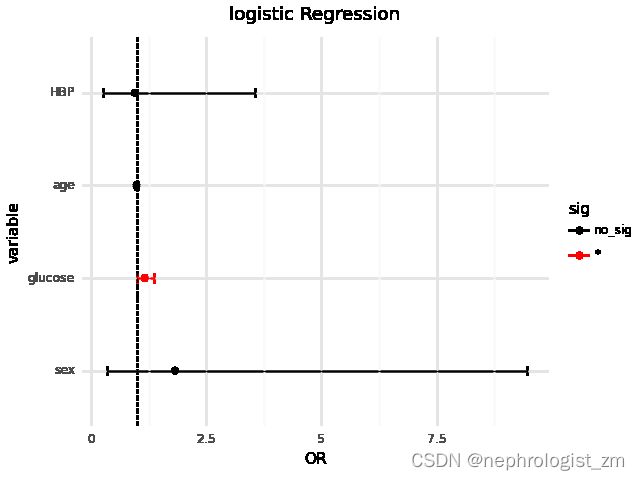
结果显示glucose是T2DM的危险因素。