【MATLAB】设置图形透明度
1 Scatter散点图
% 设置散点大小
s.SizeData = 100;
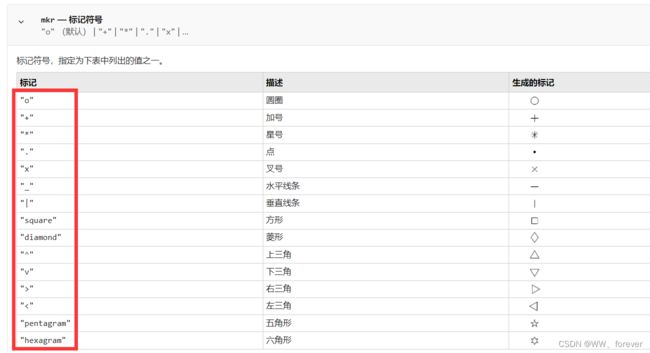
散点标记符号设置如下:
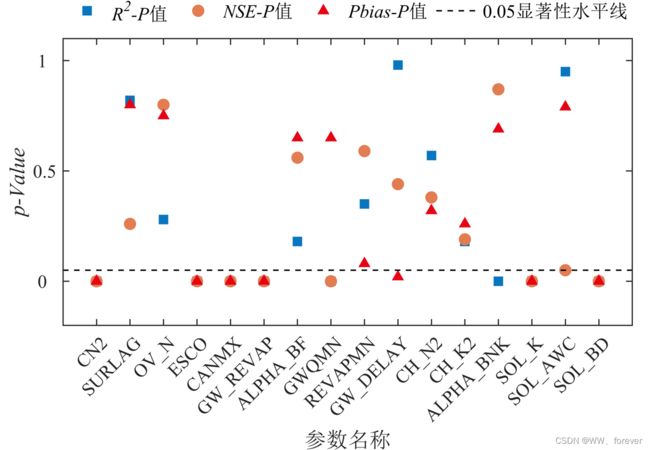
在绘制散点图时,想设置透明度:
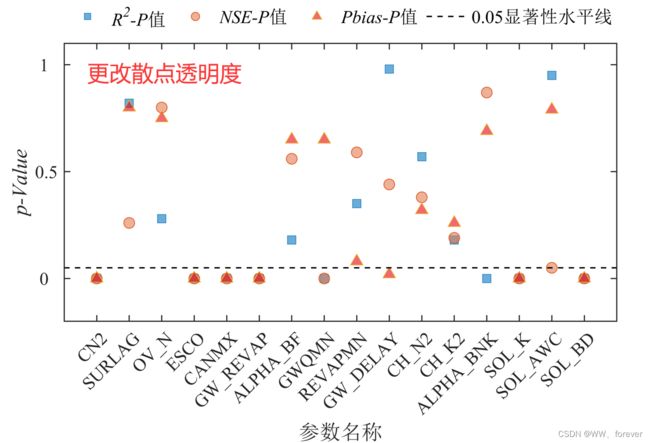
更改散点透明度后,图形如下:
相关绘图代码如下:
figure(1)
set(gcf, 'Units', figureUnits, 'Position', [0 0 figureWidth figureHeight]);
hold on;box on;grid off;
h(1) = scatter(1:nPara, R2,'s','SizeData',60,...
    'MarkerFaceAlpha',0.6,'MarkerFaceColor',[8,118,191]/255);
h(2) = scatter(1:nPara, NSE,'o','SizeData',60,...
    'MarkerFaceAlpha',0.6,'MarkerFaceColor',[226,124,81]/255);
h(3) = scatter(1:nPara, Pbias,'^','SizeData',60,...
    'MarkerFaceAlpha',0.6,'MarkerFaceColor',[230,3,20]/255);
h(4) = plot(0:nPara+1,ones(nPara+2,1)*P,'k--','linewidth',1);
set(gca,'Layer','top','FontSize',12,'Fontname', 'Times New Roman');
set(gca,'XLim',[0 nPara+1],'XTickLabelRotation',45,...
    'XTick', [ 1 :1: nPara],'XTickLabel',ParaName,...
    'FontSize',12,'Fontname', 'Times New Roman');
set(gca,'YLim',[-0.2 1.1],...
     'YTick', [ 0 :0.5: 1 ],'YTickLabel',  0 :0.5: 1  ,...
    'FontSize',13,'Fontname', 'Times New Roman');
xlabel( "参数名称" ,'Fontname', '宋体','Fontsize',15);
ylabel( "\itp-Value",'Fontname', 'Times New Roman','Fontsize',15);

set(gca,'LineWidth',0.8);      % 设置坐标轴线宽

% 设置图例
hl = legend( h([1 2 3 4]),Index(1)+"-\itP\fontname{宋体}\rm值",Index(2)+"-\itP\fontname{宋体}\rm值",Index(3)+"-\itP\fontname{宋体}\rm值","0.05\fontname{宋体}显著性水平线");
set(hl,'Box','off','Location','NorthOutside','NumColumns',4,'FontSize',13,'FontName','Times New Roman');