【DS with Python】Matplotlib入门(四):pandas可视化与seaborn常见做图功能
文章目录
- 一、matplotlib的预定义格式
-
- 1.1 pyplot更改做图格式
- 1.2 seaborn模块更改做图格式
- 二、pandas可视化
-
- 2.1 DataFrame可视化(DataFrame.plot())
- 2.1 pd.plotting()功能
- 三、seaborn的常见做图功能
-
- 3.1 sns.displot()
- 3.2 sns.jointplot()
- 3.3 sns.pairplot()
一、matplotlib的预定义格式
1.1 pyplot更改做图格式
需要更改matplotlib的基础格式,可以通过设置pyplot来选择,我们首先查看可供选择的预定义格式:
import pandas as pd
import numpy as np
import matplotlib.pyplot as plt
%matplotlib notebook #jupyter notebook可以使用此back end

plt.style.available

得到的就是已经预设好的做图格式,可以用plt.style.use()来选择格式,例如使用seaborn格式:
plt.style.use('seaborn')
fig,axes=plt.subplots()
np.random.seed(123)
random=np.random.randn(365).cumsum(0)
index=pd.date_range('1/1/2022', periods=365)
plt.plot(index,random)
而设置plt.style.use('dark_background')时,则可以得到如下图像

1.2 seaborn模块更改做图格式
导入seaborn模块(seaborn做图基于matplotlib,更细致的使用方法在未来将进一步讲解),用其中set()功能即可调用seaborn的预定义做图基础。
import seaborn as sns
sns.set()
fig,axes=plt.subplots()
np.random.seed(123)
random=np.random.randn(365).cumsum(0)
index=pd.date_range('1/1/2022', periods=365)
plt.plot(index,random)
此处得到的结果与第一张图一样。
二、pandas可视化
2.1 DataFrame可视化(DataFrame.plot())
我们可以直接对DataFrame做图,一般情况下是做折线图,也可以自行选择做图模式:
np.random.seed(123)

df = pd.DataFrame({'A': np.random.randn(365).cumsum(0),
                   'B': np.random.randn(365).cumsum(0) + 20,
                   'C': np.random.randn(365).cumsum(0) - 20},
                  index=pd.date_range('1/1/2022', periods=365))
df.plot()

可以直接选择需要做图的列来做图,也可以通过更改kind参数来更改做图的类型,主要有以下几个选项:
'line': 直线图'bar': 垂直柱状图'barh': 水平柱状图'hist': 直方图'box': 箱型图'kde': 核密度曲线图'density': 核密度曲线图'area': 区域图'pie': 饼图'scatter': 散点图'hexbin': 六边形图
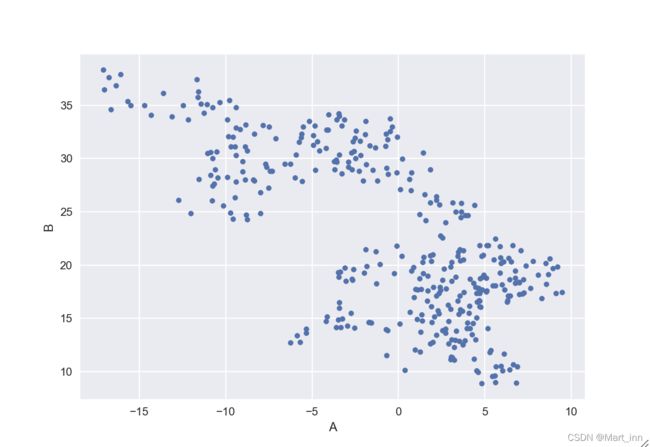
例如要用A和B数据来做散点图可以用以下代码:
df.plot('A','B', kind = 'scatter')
也可以直接用df.plot.scatter()来实现,还可以控制点的大小和颜色:
df.plot.scatter('A', 'C', c='B', s=df['B'], colormap='viridis')
df.plot.box();
df.plot.hist(alpha=0.7);
df.plot.kde();
2.1 pd.plotting()功能
在老一点的版本是pd.tools.plotting()
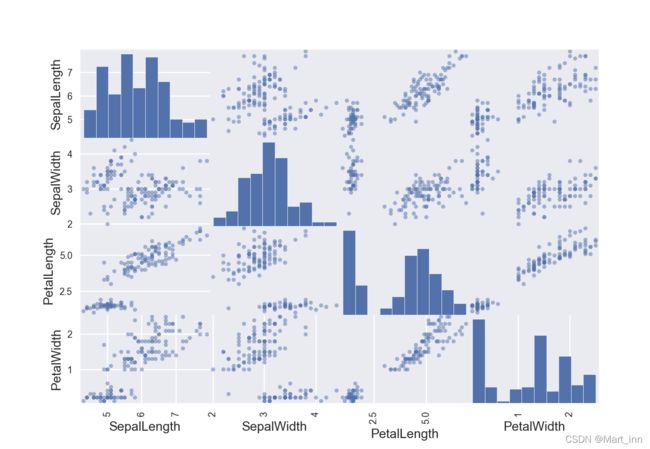
可以用pd.plotting.scatter_matrix()来直接做散点图矩阵来查看各个变量之间两两的分布关系,我们以鸢尾花的数据集为例:
iris = pd.read_csv('iris.csv')
pd.plotting.scatter_matrix(iris);
三、seaborn的常见做图功能
上面讲到,在导入seaborn库都可以用seaborn.set()功能来实现做图初始化,下面介绍几个可能会遇到的seaborn功能:
3.1 sns.displot()
在画直方图的时候如果数据来自于两个变量时,
import numpy as np
import pandas as pd
import matplotlib.pyplot as plt
import seaborn as sns

%matplotlib notebook
sns.set()

np.random.seed(1234)

v1 = pd.Series(np.random.normal(0,10,1000), name='v1')
v2 = pd.Series(2*v1 + np.random.normal(60,15,1000), name='v2')
fig,axes=plt.subplots(1,3,figsize=(13,4))


plt.sca(axes[0])
np.random.seed(1234)
v1 = pd.Series(np.random.normal(0,10,1000), name='v1')
v2 = pd.Series(2*v1 + np.random.normal(60,15,1000), name='v2')
plt.hist(v1, alpha=0.7, bins=np.arange(-50,150,5), label='v1');
plt.hist(v2, alpha=0.7, bins=np.arange(-50,150,5), label='v2');
plt.legend();


plt.sca(axes[1])
plt.hist([v1, v2], histtype='barstacked', density=True);
v3 = np.concatenate((v1,v2))
sns.kdeplot(v3);

plt.sca(axes[2])
sns.distplot(v3, hist_kws={'color': 'Teal'}, kde_kws={'color': 'Navy'});
3.2 sns.jointplot()
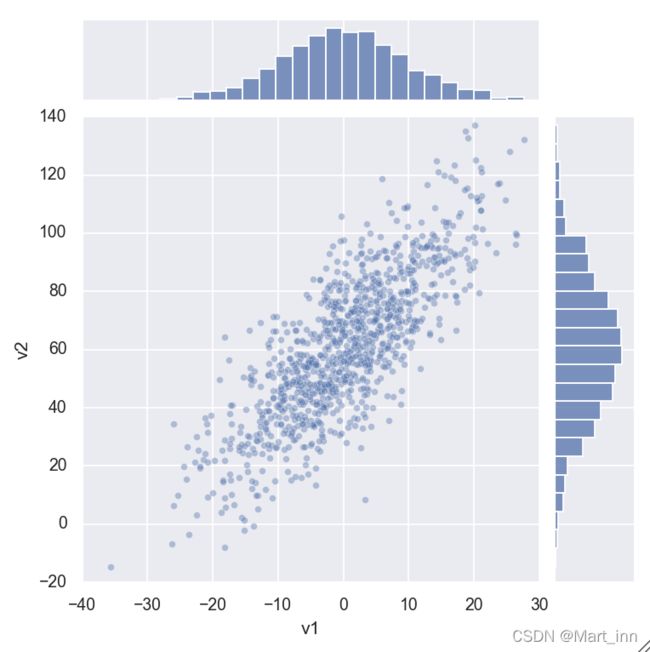
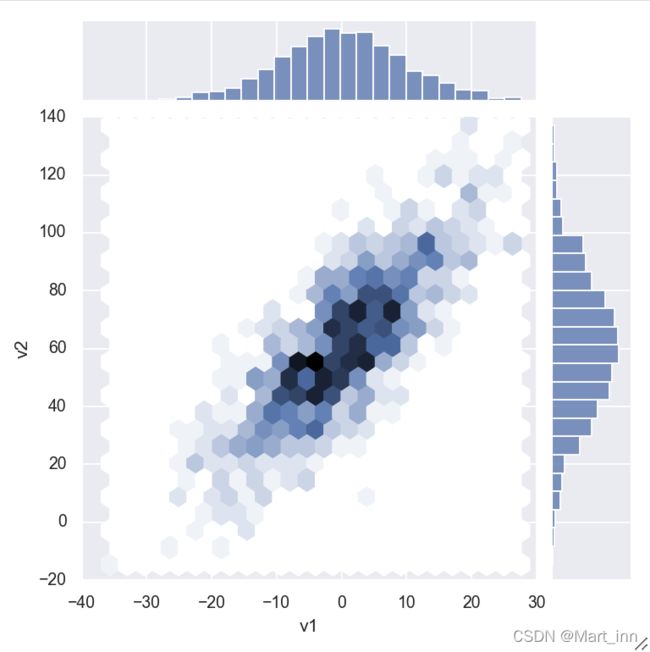
查看两个变量与其可能存在的关系时可以用到,中下部分时两个变量的散点图,上方和右方时两个变量各自的直方图,也可以调整kind参数来改变种下部分的图像格式:
import numpy as np
import pandas as pd
import matplotlib.pyplot as plt
import seaborn as sns

%matplotlib notebook
sns.jointplot(v1, v2, alpha=0.4);
sns.jointplot(v1, v2, kind='hex');
sns.set_style('white')
sns.jointplot(v1, v2, kind='kde', space=0);
3.3 sns.pairplot()
与pandas.plotting.scatter_matrix()类似,sns.pairplot()也可以用来找两组变量之间的关系,可以用参数diag_kind来设置对角线上的做图类型:
import numpy as np
import pandas as pd
import matplotlib.pyplot as plt
import seaborn as sns

%matplotlib notebook
iris = pd.read_csv('iris.csv')
sns.pairplot(iris, hue='Name', diag_kind='kde', size=2);


