一文浅入Springboot+mybatis-plus+actuator+Prometheus+Grafana+Swagger2.9.2开发运维一体化
Swagger是一个规范和完整的框架,用于生成、描述、调用和可视化 RESTFUL风格的Web服务,是非常流行的API表达工具。
Swagger能够自动生成完善的 RESTFUL AP文档,,同时并根据后台代码的修改同步更新,同时提供完整的测试页面来调试API。
Prometheus 是一个开源的服务监控系统和时序数据库,其提供了通用的数据模型和快捷数据采集、存储和查询接口。
Grafana是一个跨平台的开源的度量分析和可视化工具,可以通过将采集的数据查询然后可视化的展示,并及时通知。
Actuator同时还可以与外部应用监控系统整合,比如 Prometheus, Graphite, DataDog, Influx, Wavefront, New Relic等。
把springboot+mybatis-plus+mysql+oracle+actuator+Prometheus+Grafana+Swagger做到的效果是开发运维一体化。
环境介绍
| 技术栈 |
springboot+mybatis-plus+mysql+oracle+actuator+Prometheus+Grafana+Swagger |
|---|---|
| 软件 |
版本 |
| mysql |
8 |
| oracle |
12C |
| IDEA |
IntelliJ IDEA 2022.2.1 |
| JDK |
1.8 |
| Spring Boot |
2.7.13 |
| mybatis-plus |
3.5.3.2 |
| Swagger |
2.9.2 |
| Grafana |
10.2.0 |
| Prometheus |
2.16.0 |
本地主机应用 192.168.1.8:8007
Prometheus+Grafana安装在同一台主机
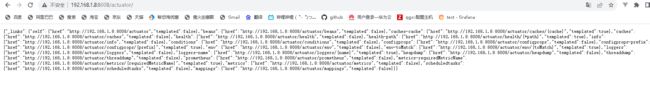
http://192.168.68.131:9090/targets
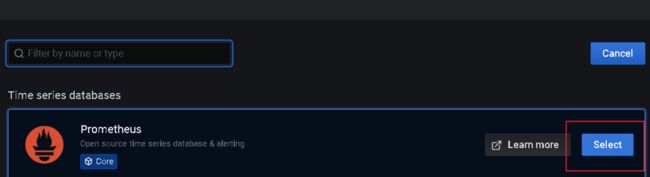
http://192.168.68.131:3000
Prometheus安装
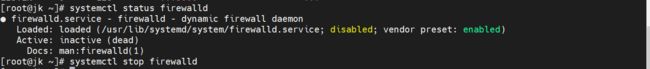
#查看防火墙状态,我们测试机早就关闭了
systemctl status firewalld
#关闭防火墙
systemctl stop firewalld
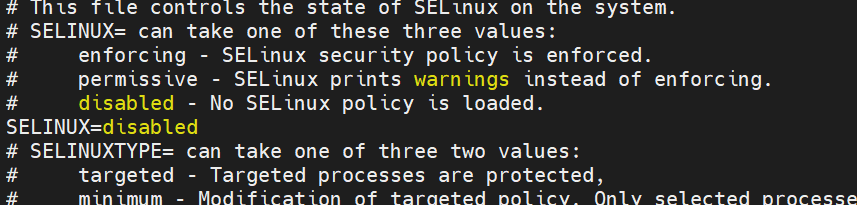
#永久关闭selinux
vi /etc/selinux/config
#将SELINUX=enforcing改为SELINUX=disabled,然后重启
#若不关闭防火墙,可打开端口,安如下修改端口号即可
firewall-cmd --zone=public --add-port=端口号/tcp --permanent
firewall-cmd --reload
#通过wget下载prometheus
wget https://github.com/prometheus/prometheus/releases/download/v2.16.0/prometheus-2.16.0.linux-amd64.tar.gz
#同步时间
yum install -y  ntpdate && ntpdate time.windows.com
#解压-安装
ll
tar -zxvf prometheus-2.16.0.linux-amd64.tar.gz -C /usr/local/
mv /usr/local/prometheus-2.16.0.linux-amd64/ /usr/local/prometheus
cd /usr/local/prometheus
ll
#启动Prometheus—使用默认配置文件启动
/usr/local/prometheus/prometheus --config.file="/usr/local/prometheus/prometheus.yml" &


#查看9090端口是否开启
ss -anlt | grep 9090
#通过浏览器进入页面
IP:9090
#数据展示
IP:9090/metrics
Grafana安装
#安装go语言环境
yum -y install go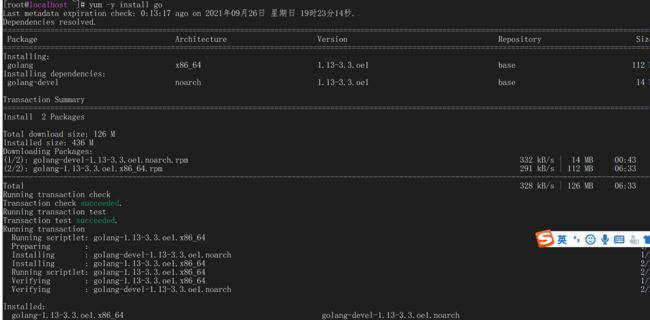
#下载grafana-7.2.0-1.x86_64.rpm
wget https://dl.grafana.com/oss/release/grafana-7.2.0-1.x86_64.rpm
#安装
yum -y install grafana-7.2.0-1.x86_64.rpm
#开机自启grafana-server
systemctl enable grafana-server
#开启grafana-server
systemctl start grafana-server

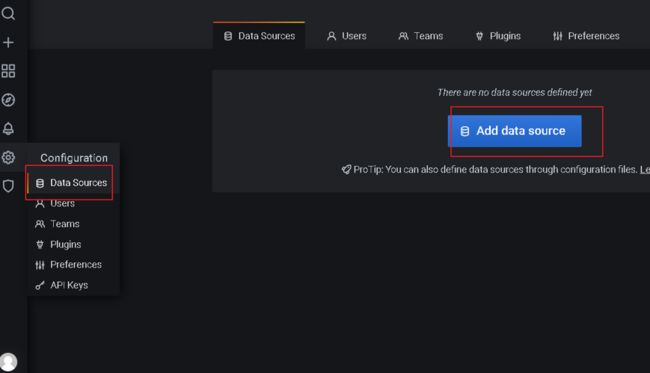
#浏览器输入IP:3000
账号密码默认admin/admin
设置新密码
springboot应用搭建
引入依赖:将springboot暴露的数据转为普罗米修斯的格式
    io.micrometer
    micrometer-registry-prometheus
    runtime
引入swagger2
        io.springfox
        springfox-swagger2
        2.9.2


        io.springfox
        springfox-swagger-ui
        2.9.2
pom.xml
io.micrometer
micrometer-registry-prometheus
runtime
org.springframework.boot
spring-boot-starter-actuator
io.springfox
springfox-swagger2
2.9.2
io.springfox
springfox-swagger-ui
2.9.2
org.springframework.boot
spring-boot-starter-web
com.baomidou
mybatis-plus-boot-starter
3.5.4.1
org.springframework.boot
spring-boot-devtools
runtime
true
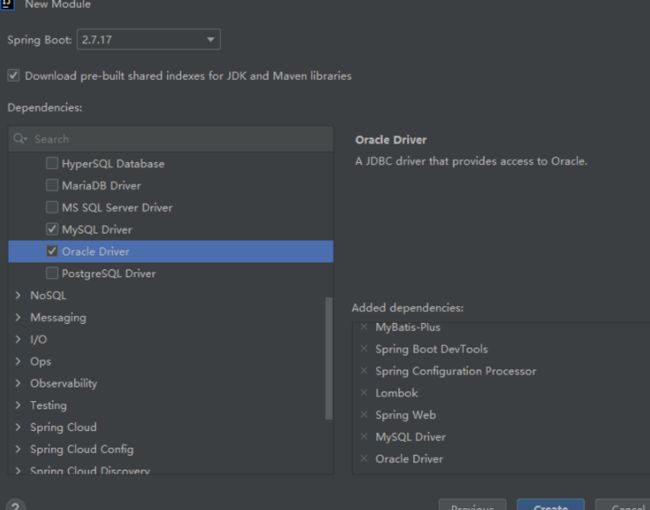
com.mysql
mysql-connector-j
runtime
com.oracle.database.jdbc
ojdbc8
runtime
org.springframework.boot
spring-boot-configuration-processor
true
org.projectlombok
lombok
true
org.springframework.boot
spring-boot-starter-test
test
com.alibaba
druid-spring-boot-starter
1.1.14
com.baomidou
dynamic-datasource-spring-boot-starter
3.5.0
p6spy
p6spy
3.9.1
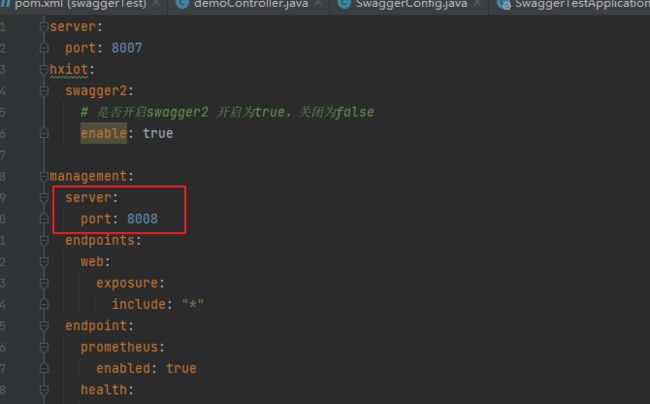
application.yml
server:
  port: 8007
hxiot:
  swagger2:
    # 是否开启swagger2 开启为true,关闭为false
    enable: true

management:
  server:
    port: 8008
  endpoints:
    web:
      exposure:
        include: "*"
  endpoint:
    prometheus:
      enabled: true
    health:
      show-details: always
  metrics:
    export:
      prometheus:
        enabled: true
spring:
  mvc:
    path match:
      matching-strategy: ant_path_matcher
  profiles:
    active: dev
spring:
  application:
    name: ProvideAPIServices
  datasource:
    dynamic:
      primary: sys2 #设置默认的数据源或者数据源组,默认值即为master
      strict: false #严格匹配数据源,默认false. true未匹配到指定数据源时抛异常,false使用默认数据源
      datasource:
        oracle:
          username: system
          password: pwd
          url: jdbc:oracle:thin:@ip:1521:orcl
          driver-class-name: oracle.jdbc.driver.OracleDriver
#          driver-class-name: com.mysql.jdbc.Driver
        wms:
          url: jdbc:p6spy:mysql://ip:3306/Wms?useUnicode=true&characterEncoding=UTF-8
          username: root
          password: 1pwd
          driver-class-name: com.p6spy.engine.spy.P6SpyDriver
#          driver-class-name: com.mysql.jdbc.Driver
        sys2:
          username: root
          password: pwd
          url: jdbc:p6spy:mysql://127.0.0.1:3306/sys?serverTimezone=Asia/Shanghai&useUnicode=true&characterEncoding=UTF-8
          driver-class-name: com.p6spy.engine.spy.P6SpyDriver
mybatis-plus:
  configuration:
    #输出日志
    log-impl: org.apache.ibatis.logging.stdout.StdOutImpl
    #配置映射规则
    map-underscore-to-camel-case: true #表示支持下划线到驼蜂的映射
    #隐藏mybatis图标
  global-config:
    banner: false
    db-config:
      logic-delete-field: status
      logic-not-delete-value: 1
      logic-delete-value: 0
Application启动类需添加Bean
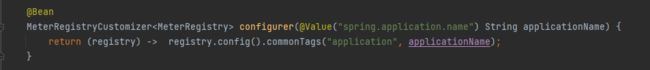
@Bean
MeterRegistryCustomizer configurer(@Value("spring.application.name") String applicationName) {
return (registry) ->  registry.config().commonTags("application", applicationName);
} 
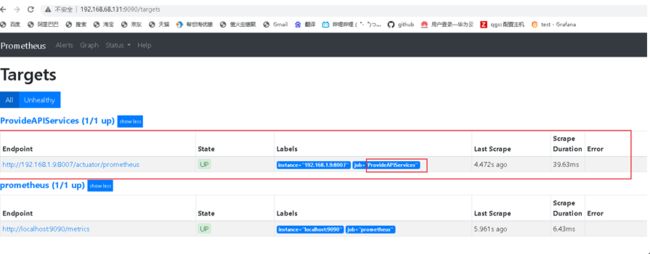
prometheus添加主机
vim /usr/local/prometheus/prometheus.yml

添加配置
#配置ProvideApiServicesApplication
- job_name: "ProvideAPIServices"
scrape_interval: 5s
metrics_path: "/actuator/prometheus"
static_configs:
- targets: ["192.168.1.9:8007"]
http://192.168.68.131:9090/targets


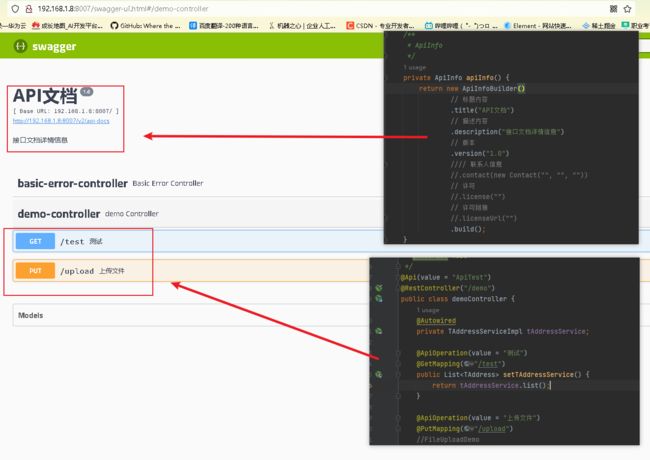
demoController
![]()
Controller需符合REST风格
@Api(value = "ApiTest")
@RestController("/demo")
public class demoController {
    @Autowired
    private TAddressServiceImpl tAddressService;

    @ApiOperation(value = "测试")
    @GetMapping("/test")
    public List setTAddressService() {
        return tAddressService.list();
    }

    @ApiOperation(value = "上传文件")
    @PutMapping("/upload")
    //FileUploadDemo
    public void fileUp(@ApiParam("文件") MultipartFile file, HttpServletRequest request) throws IOException {
        //获取文件名称
        String originalFilename = file.getOriginalFilename();
        System.out.println(originalFilename);
        //获取web服务器运行目录
        String currentPath = request.getServletContext().getRealPath("/upload/");
        System.out.println(currentPath);
        saveFile(file,currentPath);
        System.out.println("ok");
    }

    public void saveFile(MultipartFile file,String path) throws IOException {

        File dir = new File(path);
        if (!dir.exists()) {
            dir.mkdirs();
        }
        File newFile = new File(path+file.getOriginalFilename());
        file.transferTo(newFile);
    }

}
Configuration
![]()
@Configuration
@EnableSwagger2
public class SwaggerConfig {

    /**
     * Docket
     */
    @Bean
    public Docket createRestAPi() {
        // 构造函数传入初始化规范,这是swagger2规范
        return new Docket(DocumentationType.SWAGGER_2)
                //.pathMapping("/")
                // apiInfo:添加api的详情信息,参数为ApiInfo类型的参数,这个参数包含了基本描述信息:比如标题、描述、版本之类的,开发中一般都是自定义这些信息
                .apiInfo(apiInfo())
                // select、apis、paths、build 这四个是一组的,组合使用才能返回一个Docket实例对象,其中apis和paths是可选的。
                .select()
                // apis:添加过滤条件。RequestHandlerSelectors中有很多过滤方式;RequestHandlerSelectors.withMethodAnnotation(ApiOperation.class):加了ApiOperation注解的类,生成接口文档
                //扫描com.qgs.controller包下的API交给Swagger2管理
                .apis(RequestHandlerSelectors.any())
                .paths(PathSelectors.any())
                // paths:控制那些路径的api会被显示出来。
                //.paths(PathSelecto1rs.any())
                .build()
                // 是否开启swagger 如果是false,浏览器将无法访问,默认是true
                .enable(true);
    }

    /**
     * ApiInfo
     */
    private ApiInfo apiInfo() {
        return new ApiInfoBuilder()
                // 标题内容
                .title("ProvideAPIServicesAPI文档")
                // 描述内容
                .description("接口文档详情信息")
                // 版本
                .version("1.0")
                 联系人信息
                //.contact(new Contact("", "", ""))
                // 许可
                //.license("")
                // 许可链接
                //.licenseUrl("")
                .build();
    }
http://192.168.1.8:8007/swagger-ui.html
可能遇到的问题
org.springframework.context.ApplicationContextException: Failed to start bean 'documentationPluginsBootstrapper'; nested exception is java.lang.NullPointerException
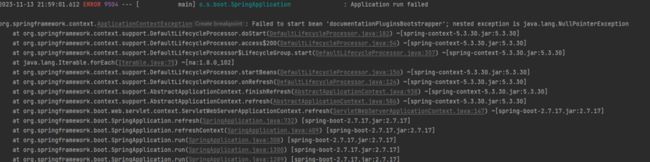
1、Springboot2.7与Swagger3.0冲突,将Swagger降低降低
2、没有配置actuator端口导致actuator抢占8007端口
Actuator同时还可以与外部应用监控系统整合,比如 Prometheus, Graphite, DataDog, Influx, Wavefront, New Relic等。这些系统提供了非常好的仪表盘、图标、分析和告警等功能,使得你可以通过统一的接口轻松的监控和管理你的应用。
Actuator使用Micrometer来整合上面提到的外部应用监控系统。这使得只要通过非常小的配置就可以集成任何应用监控系统。Spring Boot Actuator作用:健康检查、审计、统计、监控、HTTP追踪。
Prometheus 是一个开源的服务监控系统和时序数据库,其提供了通用的数据模型和快捷数据采集、存储和查询接口。它的核心组件Prometheus server会定期从静态配置的监控目标或者基于服务发现自动配置的自标中进行拉取数据,当新拉取到的数据大于配置的内存缓存区时,数据就会持久化到存储设备当中。
每个被监控的主机都可以通过专用的exporter 程序提供输出监控数据的接口,它会在目标处收集监控数据,并暴露出一个HTTP接口供Prometheus server查询,Prometheus通过基于HTTP的pull的方式来周期性的采集数据。
任何被监控的目标都需要事先纳入到监控系统中才能进行时序数据采集、存储、告警和展示,监控目标可以通过配置信息以静态形式指定,也可以让Prometheus通过服务发现的机制进行动态管理。
Prometheus 能够直接把API Server作为服务发现系统使用,进而动态发现和监控集群中的所有可被监控的对象
Grafana是一个跨平台的开源的度量分析和可视化工具,可以通过将采集的数据查询然后可视化的展示,并及时通知。
特点:
快速灵活的客户端图表,面板插件有许多不同方式的可视化指标和日志,官方库中具有丰富的仪表盘插件,比如热图、折线图、图表等多种展示方式;支持多数据源:Graphite,InfluxDB,OpenTSDB,Prometheus,Elasticsearch,CloudWatch和KairosDB等;通知提醒:以可视方式定义最重要指标的警报规则,Grafana将不断计算并发送通知,在数据达到阈值时通过Slack、PagerDuty等获得通知;4、混合展示:在同一图表中混合使用不同的数据源,可以基于每个查询指定数据源,甚至自定义数据源;5、注释标记:使用来自不同数据源的丰富事件注释图表,将鼠标悬停在事件上会显示完整的事件元数据和标记;6、过滤器:Ad-hoc过滤器允许动态创建新的键/值过滤器,这些过滤器会自动应用于使用该数据源的所有查询。