oncoPredict文献学习
原文:oncoPredict: an R package for predicting in vivo or cancer patient drug response and biomarkers from cell line screening data
oncoPredict:一种R包,用于从细胞系筛选数据中预测体内或癌症患者的药物反应和生物标志物 - PMC (nih.gov)
资料获取:https://github.com/maese005/oncoPredict and https://osf.io/c6tfx/ for data.
基本流程
流程图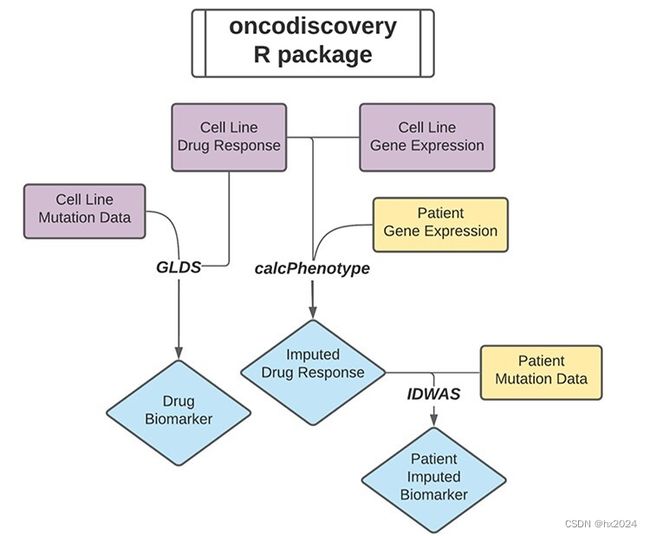
三个主要函数:分别是 GLDS、calcPhenotype 和 IDWAS。
重点是:预测药物反应函数calcPhenotype。
原理:使用大规模基因表达和药物筛选数据(训练数据集)来构建脊回归模型,然后将其应用于新的基因表达数据集(测试数据集),以对新数据集进行药物敏感性预测。这些药物模型是在去除或总结基因复制、均质化(批量校正)和过滤低变异基因后建立的。在oncoPredict中,用户可以使用根据所呈现的数据类型(微阵列、RNA测序等)确定的预设标准品,或指定汇总、均质化和过滤参数。最后,将我们的calcPhenotype函数应用于经过处理、标准化和过滤的临床肿瘤表达数据,从而对每位患者进行药物敏感性预测。
用户可以使用预先打包到 oncoPredict 中的 GDSC 或 CTRP 数据作为训练数据集,也可以提供自己的训练数据,以预测提供的任何基因表达基质中的药物反应。在训练或测试数据集中重复的基因将根据用户输入通过平均表达式删除或汇总。
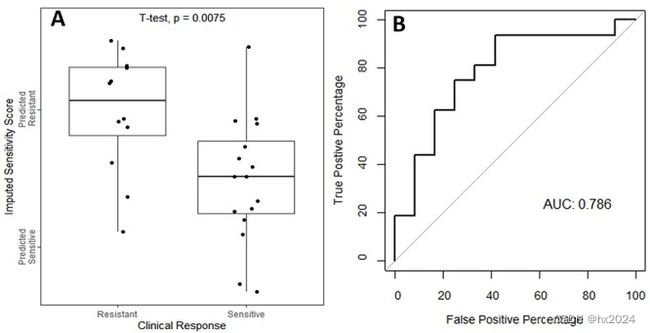
原文示例有较好的预测结果:
使用示例
rm(list = ls())
options(stringsAsFactors = F)
library(oncoPredict)
library(data.table)
library(gtools)
library(reshape2)
library(ggpubr)
th=theme(axis.text.x = element_text(angle = 45,vjust = 0.5))
dir='./DataFiles/Training Data/'
GDSC2_Expr = readRDS(file=file.path(dir,'GDSC2_Expr (RMA Normalized and Log Transformed).rds'))
GDSC2_Res = readRDS(file = file.path(dir,"GDSC2_Res.rds"))
GDSC2_Res <- exp(GDSC2_Res)


##训练表达矩阵
testExpr<- GDSC2_Expr[,sample(1:ncol(GDSC2_Expr),10)]
testExpr[1:4,1:4]
colnames(testExpr)=paste0('test',colnames(testExpr))
dim(testExpr)


##运行函数
calcPhenotype(trainingExprData = GDSC2_Expr,
              trainingPtype = GDSC2_Res,
              testExprData = testExpr,
              batchCorrect = 'eb',  #   "eb" for ComBat
              powerTransformPhenotype = TRUE,
              removeLowVaryingGenes = 0.2,
              minNumSamples = 10,
              printOutput = TRUE,
              removeLowVaringGenesFrom = 'rawData' )

##结果单独生成文件夹返回原文件(注意多次使用会覆盖)
源于《生信技能树》
药物敏感性预测R包之oncoPredict – 王进的个人网站 (jingege.wang)
补充
calcPhenotype(trainingExprData = CTRP2_Expr,
              trainingPtype = CTRP2_Res,
              testExprData = testExpr,
              batchCorrect = 'eb',
              powerTransformPhenotype = TRUE,
              removeLowVaryingGenes = 0.2,
              minNumSamples = 10,
              printOutput = TRUE,
              removeLowVaringGenesFrom = 'rawData' )
#参数详解
#'In both matrices, genes are row names and samples are column names.(行为基因 列为样本)
#需分析表达矩阵 testExprMat:A gene expression matrix (matrix格式)
#训练矩阵 trainExprMat:也就是 CTRP2或者GDSC2的细胞系矩阵
#校正参数batchCorrect:The type of batch correction to be used.
#Options are 'eb' for Combat, 'none', or 'qn' for quantile normalization.
##The default is 'eb'.(系统默认为eb参数)
# "eb" 在使用微阵列数据做训练集(细胞系),并且应用到微阵列测试集(临床样本)时比较有效
# "standardize" 在使用微阵列数据做训练集(细胞系),但应用在RNA-seq测试集(临床样本)时比较有效
结果使用补充
乙酰化和甲基化调节因子之间的串扰揭示了组蛋白修饰因子表达模式对结肠癌患者的预后和治疗意义 - PMC (nih.gov)
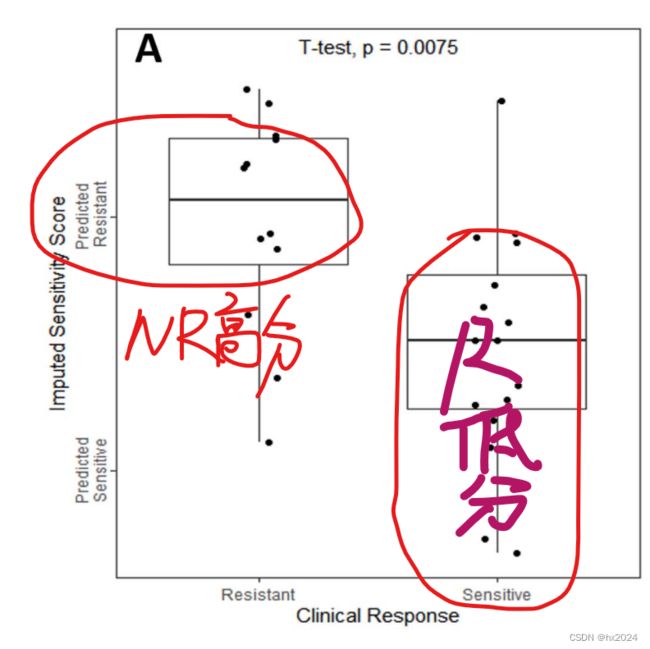
该文献中提到:Samples with AUC value in the upper third of the whole cohort (GSE39582 or TCGA-COAD) or greater than the median (SYSUCC) would be classified into the fluorouracil-nonresponse group, while samples with AUC value in the lower third (GSE39582 or TCGA-COAD) or less than the median (SYSUCC) would be classified into the fluorouracil response group.
也就是以结果中某种药物的中位值或者上1/3值为界限,分为NR和R组。大于中位值的为NR组,小于的为R也就是高反应组。
原文献也相似