ELK安装配置学习笔记
第一章 ELK原理
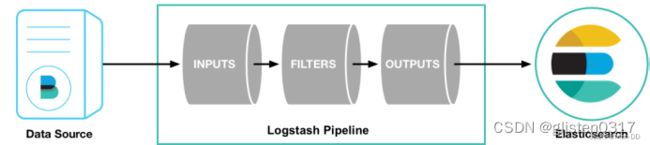
整体结构如下,其中Buffering的Redis/MQ等属于非必须的,Data Collection的Filebeats也可由logstash直接完成。

1.1.Filebeats
FileBeat专门用于转发和收集日志数据的轻量级采集工具。它可以作为代理安装在服务器上,FileBeat监视指定路径的日志文件,收集日志数据,并将收集到的日志转发到Elasticsearch或者Logstash。
启动FileBeat时,会启动一个或者多个输入(Input),这些Input监控指定的日志数据位置。FileBeat会针对每一个文件启动一个Harvester(收割机)。Harvester读取每一个文件的日志,将新的日志发送到libbeat,libbeat将数据收集到一起,并将数据发送给输出(Output)。

1.2.Logstash
Logstash是免费且开放的服务器端数据处理管道,能够从多个来源采集数据,转换数据,然后将数据发送到存储库中。
- Pipeline
包含了input—filter-output三个阶段的处理流程
插件生命周期管理
队列管理 - Logstash Event
数据在内部流转时的具体表现形式。数据在input阶段被转换为Event,在output被转化成目标格式数据
Event其实是一个Java Object,在配置文件中,对Event的属性进行增删改查 - Codec(Code/Decode)
将原始数据decode成Event;将Event encode成目标数据

数据采集与输入:Logstash支持各种输入选择,能够以连续的流式传输方式,轻松地从日志、指标、Web应用以及数据存储中采集数据。
实时解析和数据转换:通过Logstash过滤器解析各个事件,识别已命名的字段来构建结构,并将它们转换成通用格式,最终将数据从源端传输到存储库中。
存储与数据导出:Logstash提供多种输出选择,可以将数据发送到指定的地方。
Logstash通过管道完成数据的采集与处理,管道配置中包含input、output和filter(可选)插件,input和output用来配置输入和输出数据源、filter用来对数据进行过滤或预处理。
1.3.Logstash vs FileBeat
Logstash是在jvm上运行的,资源消耗比较大。而FileBeat是基于golang编写的,功能较少但资源消耗也比较小,更轻量级。
Logstash 和 Filebeat都具有日志收集功能,Filebeat更轻量,占用资源更少
Logstash 具有Filter功能,能过滤分析日志
一般结构都是Filebeat采集日志,然后发送到消息队列、Redis、MQ中,然后Logstash去获取,利用Filter功能过滤分析,然后存储到Elasticsearch中
FileBeat和Logstash配合,实现背压机制。当将数据发送到Logstash或 Elasticsearch时,Filebeat使用背压敏感协议,以应对更多的数据量。如果Logstash正在忙于处理数据,则会告诉Filebeat 减慢读取速度。一旦拥堵得到解决,Filebeat就会恢复到原来的步伐并继续传输数据。
1.4.Elasticsearch
Elasticsearch是一个开源的分布式搜索和分析引擎。它的核心目标是提供实时的搜索和分析功能,能够对大规模数据进行高效的检索和聚合。
架构:Elasticsearch采用分布式架构,数据被分割成多个分片(shard),每个分片可以分布在不同的节点上。每个分片都是一个独立的Lucene索引,拥有自己的倒排索引,以实现快速的全文搜索。集群由多个节点组成,每个节点可以拥有多个分片。集群通过选举主节点来进行协调和管理。
原理:Elasticsearch使用倒排索引来加速搜索,它将每个词汇与包含这个词汇的文档关联起来,以实现高速的全文搜索。当用户发起搜索请求时,Elasticsearch会将查询解析成一个查询执行计划,然后并行搜索各个分片,最后将结果合并返回。分片的分布式性质使得Elasticsearch能够横向扩展,处理大规模数据。
1.5.Kibana
Kibana是一个用于数据可视化和分析的工具,与Elasticsearch紧密集成,可以创建各种图表、仪表盘和报表来展示数据。
架构:Kibana提供了一个Web界面,允许用户通过图形界面配置可视化元素。它支持多种图表类型,如柱状图、折线图、地图等。用户可以通过搜索和过滤来探索数据,并将数据可视化组合成仪表盘。
原理:Kibana使用Elasticsearch的查询和聚合功能来获取数据,然后将数据转化为可视化组件。用户可以通过Kibana界面构建查询、定义聚合、创建图表和仪表盘,从而将数据转化为有意义的可视化展示。
参考文章:
https://blog.csdn.net/menxu_work/article/details/126032167
https://blog.csdn.net/kankan_s/article/details/132157557
第二章 资源规划
2.1.资源配置
| 主机名 | IP | 服务器配置 | 操作系统 |
|---|---|---|---|
| nginx01 | x.x.x.x | 8c、16G、500GB | CentOS 7.8.2003 |
| nginx02 | x.x.x.x | 8c、16G、500GB | CentOS 7.8.2003 |
2.2.组件规划
| 组件 | 版本 | 服务端口 | nginx01 | nginx02 | |
| ELK | Filebeat | 8.9.1 | - | ★ | ★ |
| Metricbeat | 7.17.13 | - | ★ | ★ | |
| Logstash | 8.9.1 | TCP/5044 | ★ | ||
| Elasticsearch | 8.9.1 | TCP/9200 | ★ | ||
| Node.js | 6.16.0 | - | ★ | ||
| Grunt | 1.0.1 | - | ★ | ||
| ELasticsearch-head | 5.0.0 | TCP/9100 | ★ | ||
| Kibana | 8.9.1 | TCP/5601 | ★ | ||
| 应用 | nginx | 1.20.2 | TCP/80等 | ★ | ★ |
第三章 基础环境准备
3.1.SSH免密登录
在nginx01、nginx02上生成公钥,配置免密登录,确保nginx02可以免密登录
ssh-keygen -t rsa -f ~/.ssh/id_rsa -C username_root
ssh-copy-id -i ~/.ssh/id_rsa.pub -p 22 [email protected]
3.2.修改主机名
在nginx01上,临时修改
hostnamectl nginx01
永久修改
echo "nginx01" > /etc/hostname
在nginx02上,临时修改
hostnamectl nginx02
永久修改
echo "nginx02" > /etc/hostname
3.3.修改hosts列表
在/etc/hosts文件中增加以下配置内容
x.x.x.x      nginx01
x.x.x.x      nginx02
3.4.禁用SELinux
临时禁用SELinux
[root@nginx01 ~]# getenforce
Enforcing
[root@nginx01 ~]# setenforce 0
[root@nginx01 ~]# getenforce
Permissive
永久禁用SELinux
[root@nginx01 ~]# sed -i 's/SELINUX=enforcing/SELINUX=disabled/g' /etc/selinux/config
[root@nginx01 ~]# cat /etc/selinux/config

# This file controls the state of SELinux on the system.
# SELINUX= can take one of these three values:
#     enforcing - SELinux security policy is enforced.
#     permissive - SELinux prints warnings instead of enforcing.
#     disabled - No SELinux policy is loaded.
SELINUX=disabled
# SELINUXTYPE= can take one of three values:
#     targeted - Targeted processes are protected,
#     minimum - Modification of targeted policy. Only selected processes are protected.
#     mls - Multi Level Security protection.
SELINUXTYPE=targeted
3.5.挂载目录
在nginx02上创建数据目录/data
mkdir /data
查看/dev/vda3的UUID,并将磁盘分区挂载到/data上
[root@nginx02 ~]# lsblk -f
NAME            FSTYPE      LABEL    UUID                                   MOUNTPOINT
sr0
sr1             iso9660     config-2 2022-10-08-10-56-06-00
vda
├─vda1          xfs                  87943df1-de4b-4ad8-9c27-99092bb70bb0   /boot
├─vda2          LVM2_member          VAWxc5-lUMB-3fJW-66S8-jJcm-RXDr-WHiSMZ
│ ├─centos-root xfs                  887e9be7-8432-4ed3-bae2-fc0efeed6702   /
│ └─centos-swap swap                 49eed0dc-011b-47e2-9ece-8c5df0250c0e   [SWAP]
└─vda3          xfs                  060ad417-4455-46c0-89b1-da3bb0d958ec
[root@nginx02 ~]# echo "UUID=060ad417-4455-46c0-89b1-da3bb0d958ec /data xfs     defaults       0 0" >> /etc/fstab
[root@nginx02 ~]# cat /etc/fstab

#
# /etc/fstab
# Created by anaconda on Thu Jul 14 15:38:57 2022
#
# Accessible filesystems, by reference, are maintained under '/dev/disk'
# See man pages fstab(5), findfs(8), mount(8) and/or blkid(8) for more info
#
/dev/mapper/centos-root /                       xfs     defaults        0 0
UUID=87943df1-de4b-4ad8-9c27-99092bb70bb0 /boot                   xfs     defaults        0 0
/dev/mapper/centos-swap swap                    swap    defaults        0 0
/dev/mapper/centos-swap none    swap    sw,comment=cloudconfig  0       0
UUID=060ad417-4455-46c0-89b1-da3bb0d958ec /data xfs     defaults       0 0
[root@nginx02 ~]# mount -a
[root@nginx02 ~]# lsblk
NAME            MAJ:MIN RM  SIZE RO TYPE MOUNTPOINT
sr0              11:0    1 1024M  0 rom
sr1              11:1    1  444K  0 rom
vda             252:0    0  500G  0 disk
├─vda1          252:1    0    1G  0 part /boot
├─vda2          252:2    0   39G  0 part
│ ├─centos-root 253:0    0   34G  0 lvm  /
│ └─centos-swap 253:1    0    5G  0 lvm  [SWAP]
└─vda3          252:3    0  460G  0 part /data
3.6.新建用户
新建es用户
useradd es
3.7.进程最大打开文件描述符数
当前用户的文件描述符限制(file descriptor limit)的命令。该限制用于控制一个进程可以同时打开的文件数。
该值过低会导致Elasticsearch进程无法启动,出现报错:
bootstrap check failure [1] of [4]: max file descriptors [4096] for elasticsearch process is too low, increase to at least [65535]
在文件/etc/security/limits.conf最后增加如下内容:
es soft nofile 65535
es hard nofile 65535
soft表示软限制(即进程能够自己修改的限制)
hard表示硬限制(即只有超级用户才能修改的限制)
es表示只对es用户生效
使配置生效,并切换到es用户确认是否生效
[root@nginx02 ~]# ulimit -n
1024
[root@nginx02 ~]# su - es
[es@nginx02 ~]$ ulimit -n
65535
3.8.虚拟内存
虚拟内存太低会导致Elasticsearch无法启动,出现报错:
bootstrap check failure [2] of [4]: max virtual memory areas vm.max_map_count [65530] is too low, increase to at least [262144]
在文件/etc/sysctl.conf末尾添加如下内容:
echo "vm.max_map_count=262144" >> /etc/sysctl.conf
使生效并确认结果
[root@nginx02 ~]# sysctl vm.max_map_count
vm.max_map_count = 65530
[root@nginx02 ~]# sysctl -p
vm.max_map_count = 262144
[root@nginx02 ~]# sysctl vm.max_map_count
vm.max_map_count = 262144
3.9.安装包准备
官方下载页面:https://www.elastic.co/cn/downloads/
Filebeat:https://artifacts.elastic.co/downloads/beats/filebeat/filebeat-8.9.1-linux-x86_64.tar.gz
Logstash:https://artifacts.elastic.co/downloads/logstash/logstash-8.9.1-linux-x86_64.tar.gz
Elasticsearch:https://artifacts.elastic.co/downloads/elasticsearch/elasticsearch-8.9.1-linux-x86_64.tar.gz
Kibana:https://artifacts.elastic.co/downloads/kibana/kibana-8.9.1-linux-x86_64.tar.gz
Metricbeat:https://artifacts.elastic.co/downloads/beats/metricbeat/metricbeat-7.17.13-linux-x86_64.tar.gz
将下载好的安装包上传到nginx02的/data/install_packages下
[root@nginx02 ~]# ll -h /data/install_packages/
total 1.3G
-rw-r--r--. 1 root root 578M Aug 22 14:33 elasticsearch-8.9.1-linux-x86_64.tar.gz
-rw-r--r--. 1 root root 844K Aug 24 09:04 elasticsearch-head-v5.0.0.tar.gz
-rw-r--r--. 1 root root  18M Aug 25 09:16 es-head.tar.gz
-rw-r--r--. 1 root root  47M Aug 22 14:41 filebeat-8.9.1-linux-x86_64.tar.gz
-rw-r--r--. 1 root root 270M Aug 22 14:41 kibana-8.9.1-linux-x86_64.tar.gz
-rw-r--r--. 1 root root 331M Aug 22 14:37 logstash-8.9.1-linux-x86_64.tar.gz
-rw-r--r--. 1 root root  43M Sep 19 15:19 metricbeat-7.17.13-linux-x86_64.tar.gz
-rw-r--r--. 1 root root 9.0M Aug 24 09:21 node-v6.16.0-linux-x64.tar.xz
第四章 应用(nginx为例)安装
4.1.准备依赖组件
在/root/目录下进行解压
tar -zxvf openssl-1.0.2k.tar.gz
tar -zxvf pcre-8.35.tar.gz
tar -zxvf zlib-1.2.8.tar.gz
4.2.安装nginx
解压nginx压缩包,并进行编译安装
tar -zxvf nginx-1.20.2.tar.gz
cd nginx-1.20.2/

./configure \
   --prefix=/usr/local/nginx \
   --with-http_stub_status_module \
   --with-http_ssl_module \
   --with-http_stub_status_module \
   --with-http_realip_module \
   --with-threads \
   --with-stream \
   --with-stream_ssl_preread_module \
   --with-stream_ssl_module \
   --with-pcre=/root/pcre-8.35 \
   --with-openssl=/root/openssl-1.0.2k \
   --with-zlib=/root/zlib-1.2.8

make && make install
4.3.制作系统服务
将nginx服务配置为系统服务
vim /usr/lib/systemd/system/nginx.service

[Unit]
Description=nginx web service
Documentation=http://nginx.org/en/docs/
After=network.target

[Service]
Type=forking
PIDFile=/usr/local/nginx/logs/nginx.pid
ExecStartPre=/usr/local/nginx/sbin/nginx -t -c /usr/local/nginx/conf/nginx.conf
ExecStart=/usr/local/nginx/sbin/nginx
ExecReload=/usr/local/nginx/sbin/nginx -s reload
ExecStop=/usr/local/nginx/sbin/nginx -s stop
PrivateTmp=true

[Install]
WantedBy=default.target
修改权限
chmod 755 /usr/lib/systemd/system/nginx.service
启动nginx
systemctl enable --now nginx
systemctl status nginx
4.4.日志配置
注:本例nginx配置的stream转发,因此日志也是依照stream进行设置的字段变量
配置日志为
log_format proxy '[$time_local] [client]$remote_addr:$remote_port [proxy]$server_addr:$server_port [proxy_status]$status [server]$upstream_addr [protocol]$protocol [upstream_duration]$upstream_connect_time [client2proxy]$bytes_received [proxy2client]$bytes_sent [proxy2server]$upstream_bytes_sent [server2proxy]$upstream_bytes_received';
检查配置文件是否有语法错误
/usr/local/nginx/sbin/nginx -t
对nginx日志进行切割处理,编写切割脚本,/root/cutnginxlog.sh
#!/bin/bash
# define env
LOGS_PATH=/usr/local/nginx/logs
TODAY=$(date -d 'today' +%Y-%m-%d)
RMDAY=$(date -d '1 month ago' +%Y-%m-%d)

# generate history log of today
mv ${LOGS_PATH}/error.log ${LOGS_PATH}/error_${TODAY}.log
mv ${LOGS_PATH}/access.log ${LOGS_PATH}/access_${TODAY}.log

# 向Nginx主进程发送 USR1 信号,就可以重新打开日志文件
kill -USR1 $(cat /usr/local/nginx/logs/nginx.pid)

# delete history logs
rm -f ${LOGS_PATH}/error_${RMDAY}.log
rm -f ${LOGS_PATH}/access_${RMDAY}.log
赋予执行权限
chmod +x /root/cutnginxlog.sh
配置定时任务
crontab -e
59 23 * * * sh /root/cutnginxlog.sh >> /root/cutnginxlog.log 2>&1
systemctl restart crond
4.5.配置防火墙
开启TCP:8081和TCP:8090端口
firewall-cmd --add-port=80/tcp --permanent
systemctl restart firewalld
第五章 Elasticsearch安装配置
5.1.安装
解压安装包到/data/下
tar -zxvf /data/install_packages/elasticsearch-8.9.1-linux-x86_64.tar.gz -C /data/
mv /data/elasticsearch-8.9.1/ /data/elasticsearch
将elasticsearch目录归属修改为es用户
[root@nginx02 ~]# chown -R es:es /data/elasticsearch/
[root@nginx02 ~]# ll -d /data/elasticsearch/
drwxr-xr-x. 10 es es 167 Aug 23 10:39 /data/elasticsearch/
5.2.生成SSL证书
生成ca证书,默认存储在/data/elasticsearch/下,文件名为elastic-stack-ca.p12,默认设置为空
[root@nginx02 ~]# /data/elasticsearch/bin/elasticsearch-certutil ca
This tool assists you in the generation of X.509 certificates and certificate
signing requests for use with SSL/TLS in the Elastic stack.

The 'ca' mode generates a new 'certificate authority'
This will create a new X.509 certificate and private key that can be used
to sign certificate when running in 'cert' mode.

Use the 'ca-dn' option if you wish to configure the 'distinguished name'
of the certificate authority

By default the 'ca' mode produces a single PKCS#12 output file which holds:
    * The CA certificate
    * The CA's private key

If you elect to generate PEM format certificates (the -pem option), then the output will
be a zip file containing individual files for the CA certificate and private key

Please enter the desired output file [elastic-stack-ca.p12]:
Enter password for elastic-stack-ca.p12 :
[root@nginx02 ~]# ll /data/elasticsearch/elastic-stack-ca.p12
-rw-------. 1 root root 2672 Aug 23 14:41 /data/elasticsearch/elastic-stack-ca.p12
生成凭证,默认存储在/data/elasticsearch/下,文件名为elastic-certificates.p12,默认设置为空
[root@nginx02 ~]# /data/elasticsearch/bin/elasticsearch-certutil cert --ca /data/elasticsearch/elastic-stack-ca.p12
This tool assists you in the generation of X.509 certificates and certificate
signing requests for use with SSL/TLS in the Elastic stack.

The 'cert' mode generates X.509 certificate and private keys.
    * By default, this generates a single certificate and key for use
       on a single instance.
    * The '-multiple' option will prompt you to enter details for multiple
       instances and will generate a certificate and key for each one
    * The '-in' option allows for the certificate generation to be automated by describing
       the details of each instance in a YAML file

    * An instance is any piece of the Elastic Stack that requires an SSL certificate.
      Depending on your configuration, Elasticsearch, Logstash, Kibana, and Beats
      may all require a certificate and private key.
    * The minimum required value for each instance is a name. This can simply be the
      hostname, which will be used as the Common Name of the certificate. A full
      distinguished name may also be used.
    * A filename value may be required for each instance. This is necessary when the
      name would result in an invalid file or directory name. The name provided here
      is used as the directory name (within the zip) and the prefix for the key and
      certificate files. The filename is required if you are prompted and the name
      is not displayed in the prompt.
    * IP addresses and DNS names are optional. Multiple values can be specified as a
      comma separated string. If no IP addresses or DNS names are provided, you may
      disable hostname verification in your SSL configuration.


    * All certificates generated by this tool will be signed by a certificate authority (CA)
      unless the --self-signed command line option is specified.
      The tool can automatically generate a new CA for you, or you can provide your own with
      the --ca or --ca-cert command line options.


By default the 'cert' mode produces a single PKCS#12 output file which holds:
    * The instance certificate
    * The private key for the instance certificate
    * The CA certificate

If you specify any of the following options:
    * -pem (PEM formatted output)
    * -multiple (generate multiple certificates)
    * -in (generate certificates from an input file)
then the output will be be a zip file containing individual certificate/key files

Enter password for CA (/data/elasticsearch/elastic-stack-ca.p12) :
Please enter the desired output file [elastic-certificates.p12]:
Enter password for elastic-certificates.p12 :

Certificates written to /data/elasticsearch/elastic-certificates.p12

This file should be properly secured as it contains the private key for
your instance.
This file is a self contained file and can be copied and used 'as is'
For each Elastic product that you wish to configure, you should copy
this '.p12' file to the relevant configuration directory
and then follow the SSL configuration instructions in the product guide.

For client applications, you may only need to copy the CA certificate and
configure the client to trust this certificate.
[root@nginx02 ~]# ll /data/elasticsearch/elastic-certificates.p12
-rw-------. 1 root root 3596 Aug 23 14:44 /data/elasticsearch/elastic-certificates.p12
将生成的证书和凭证拷贝到config目录下,如果有多个节点的话,则每个节点的的config下边都需要放一份证书文件,或者配置文件,直接指定这同一份证书文件。
cp /data/elasticsearch/elastic-stack-ca.p12 /data/elasticsearch/config/
cp /data/elasticsearch/elastic-certificates.p12 /data/elasticsearch/config/
重新将文件夹及下面文件归属改为es用户
chown -R es:es /data/elasticsearch/
5.3.配置
备份配置文件/data/elasticsearch/config/elasticsearch.yml
cp /data/elasticsearch/config/elasticsearch.yml /data/elasticsearch/config/elasticsearch.yml.bak.20230823
修改配置文件,主要修改点如下
# 解除注释并修改访问IP,如果全部网卡均开放访问则设置为0.0.0.0
network.host: X.X.X.X
# 修改访问端口
http.port: 9200
# 指定要使用的初始种子节点列表。这些节点将被用于初始化集群,并在新节点加入时用于自动发现其他节点
discovery.seed_hosts: ["nginx02"]
# 指定一组初始主控节点列表。这些节点将在首次启动时选举出主控节点,并初始化集群状态
cluster.initial_master_nodes: ["nginx02"]
# 开启安全认证
xpack.security.enabled: true
# 开启ssl
xpack.security.transport.ssl.enabled: true
xpack.security.transport.ssl.verification_mode: certificate
# 生成ca证书
xpack.security.transport.ssl.keystore.path: /data/elasticsearch/config/elastic-certificates.p12
xpack.security.transport.ssl.truststore.path: /data/elasticsearch/config/elastic-certificates.p12
注:从Elasticsearch 7.0版本开始,必须配置discovery.seed_hosts、discovery.seed_providers或cluster.initial_master_nodes中的至少一个参数才能启,建议同时配置discovery.seed_hosts和cluster.initial_master_nodes参数,以确保兼容性和稳定性。
5.4.制作系统服务
将Elasticsearch配置成系统服务,新建系统服务service文件
touch /usr/lib/systemd/system/elasticsearch.service
配置系统服务文件内容
[Unit]
Description=elasticsearch service
After=network.target remote-fs.target nss-lookup.target

[Service]
User=es
LimitNOFILE=65535
Type=forking
ExecStart=/data/elasticsearch/bin/elasticsearch -d

[Install]
WantedBy=default.target
启动elasticsearch服务
[root@nginx02 ~]# systemctl enable --now elasticsearch.service
[root@nginx02 ~]# systemctl status elasticsearch.service
● elasticsearch.service - elasticsearch service
   Loaded: loaded (/usr/lib/systemd/system/elasticsearch.service; enabled; vendor preset: disabled)
   Active: active (running) since Wed 2023-08-23 14:24:05 CST; 8s ago
  Process: 184986 ExecStart=/data/elasticsearch/bin/elasticsearch -d (code=exited, status=0/SUCCESS)
 Main PID: 185052 (java)
   CGroup: /system.slice/elasticsearch.service
           ├─185052 /data/elasticsearch/jdk/bin/java -Des.networkaddress.cache.ttl=60 -Des.networkaddress.cache.negative.ttl=10 -Djava.security...
           └─185079 /data/elasticsearch/modules/x-pack-ml/platform/linux-x86_64/bin/controller

Aug 23 14:24:05 nginx02 elasticsearch[184986]: [2023-08-23T14:24:05,229][INFO ][o.e.b.BootstrapChecks    ] [nginx02] bound or publishing... checks
Aug 23 14:24:05 nginx02 elasticsearch[184986]: [2023-08-23T14:24:05,232][WARN ][o.e.c.c.ClusterBootstrapService] [nginx02] this node is locked ...
Aug 23 14:24:05 nginx02 elasticsearch[184986]: [2023-08-23T14:24:05,334][INFO ][o.e.c.s.MasterService    ] [nginx02] elected-as-master ([1] nod...
Aug 23 14:24:05 nginx02 elasticsearch[184986]: [2023-08-23T14:24:05,381][INFO ][o.e.c.s.ClusterApplierService] [nginx02] master node cha...ion=37}
Aug 23 14:24:05 nginx02 elasticsearch[184986]: [2023-08-23T14:24:05,438][INFO ][o.e.c.f.AbstractFileWatchingService] [nginx02] starting ...her ...
Aug 23 14:24:05 nginx02 elasticsearch[184986]: [2023-08-23T14:24:05,441][INFO ][o.e.c.f.AbstractFileWatchingService] [nginx02] file sett...tid=54]
Aug 23 14:24:05 nginx02 elasticsearch[184986]: [2023-08-23T14:24:05,446][INFO ][o.e.c.c.NodeJoinExecutor ] [nginx02] node-join: [{nginx0...ection]
Aug 23 14:24:05 nginx02 elasticsearch[184986]: [2023-08-23T14:24:05,447][INFO ][o.e.h.AbstractHttpServerTransport] [nginx02] publish_add...2:9200}
Aug 23 14:24:05 nginx02 elasticsearch[184986]: [2023-08-23T14:24:05,448][INFO ][o.e.n.Node               ] [nginx02] started {nginx02}{QScv1brl...
Aug 23 14:24:05 nginx02 systemd[1]: Started elasticsearch service.
Hint: Some lines were ellipsized, use -l to show in full.
5.5.设置密码
执行指令设置密码,执行设置密码命令后是如下命令提示,设置全部账号的密码(密码为xxxxxxx)
[root@nginx02 ~]# /data/elasticsearch/bin/elasticsearch-setup-passwords interactive
******************************************************************************
Note: The 'elasticsearch-setup-passwords' tool has been deprecated. This       command will be removed in a future release.
******************************************************************************

Initiating the setup of passwords for reserved users elastic,apm_system,kibana,kibana_system,logstash_system,beats_system,remote_monitoring_user.
You will be prompted to enter passwords as the process progresses.
Please confirm that you would like to continue [y/N]y


Enter password for [elastic]:
Reenter password for [elastic]:
Enter password for [apm_system]:
Reenter password for [apm_system]:
Enter password for [kibana_system]:
Reenter password for [kibana_system]:
Enter password for [logstash_system]:
Reenter password for [logstash_system]:
Enter password for [beats_system]:
Reenter password for [beats_system]:
Enter password for [remote_monitoring_user]:
Reenter password for [remote_monitoring_user]:
Changed password for user [apm_system]
Changed password for user [kibana_system]
Changed password for user [kibana]
Changed password for user [logstash_system]
Changed password for user [beats_system]
Changed password for user [remote_monitoring_user]
Changed password for user [elastic]
5.6.添加防火墙策略
将TCP/9200增加至防火墙策略中
[root@nginx02 ~]# firewall-cmd --add-port=9200/tcp --permanent
success
[root@nginx02 ~]# systemctl restart firewalld
5.7.验证
访问页面http://x.x.x.x:9200/,输入elastic用户密码后可以正常访问

5.8.HEAD插件
elasticsearch head是一款开源的可视化的elasticsearch可视化工具,使用相当方便和广泛。因为服务器处于内网,无法连接互联网,因此需要在其他可以连通互联网的服务器上制作HEAD。
5.8.1.安装包准备
Node.js
下载页面:https://nodejs.org/dist/,选择6.16.0版本(高版本可能和操作系统GBLIC版本不兼容)
将下载的安装包上传到/root/目录下,并解压
tar -xvf node-v6.16.0-linux-x64.tar.xz
elasticsearch-haed
下载链接:https://github.com/mobz/elasticsearch-head/archive/master.zip
将下载的安装包上传到/root/目录下,并解压
unzip elasticsearch-head-master.zip
5.8.2.Node.js安装
head是一个Node.js项目,所以需要先安装Node.js才可以运行head。安装了Node.js后,安装需要用到的npm命令就自带安装上了。
将node、npm命令做软链接(必须要做软连接,因为node默认去找/usr/local/bin,否则会报错)
ln -s /root/node-v6.16.0-linux-x64/bin/npm /usr/local/bin/
ln -s /root/node-v6.16.0-linux-x64/bin/node /usr/local/bin/
验证
[root@localhost ~]# npm -v
3.10.10
[root@localhost ~]# node -v
v6.16.0
报错:
安装nodejs后,执行npm和node时出现如下报错:
[root@nginx02 ~]# npm -v
node: /lib64/libm.so.6: version `GLIBC_2.27' not found (required by node)
node: /lib64/libc.so.6: version `GLIBC_2.25' not found (required by node)
node: /lib64/libc.so.6: version `GLIBC_2.28' not found (required by node)
node: /lib64/libstdc++.so.6: version `CXXABI_1.3.9' not found (required by node)
node: /lib64/libstdc++.so.6: version `GLIBCXX_3.4.20' not found (required by node)
node: /lib64/libstdc++.so.6: version `GLIBCXX_3.4.21' not found (required by node)
[root@nginx02 ~]# node -v
node: /lib64/libm.so.6: version `GLIBC_2.27' not found (required by node)
node: /lib64/libc.so.6: version `GLIBC_2.25' not found (required by node)
node: /lib64/libc.so.6: version `GLIBC_2.28' not found (required by node)
node: /lib64/libstdc++.so.6: version `CXXABI_1.3.9' not found (required by node)
node: /lib64/libstdc++.so.6: version `GLIBCXX_3.4.20' not found (required by node)
node: /lib64/libstdc++.so.6: version `GLIBCXX_3.4.21' not found (required by node)
因为nodejs版本过高导致,根据操作系统centos的版本,Node.js依赖支持的gblic库不同,而在操作系统内支持的gblic库同样有版本要求,可以根据以下命令查看系统内安装的glibc版本。
[root@nginx02 ~]# strings /lib64/libc.so.6 | grep ^GLIBC_
GLIBC_2.2.5
GLIBC_2.2.6
GLIBC_2.3
GLIBC_2.3.2
GLIBC_2.3.3
GLIBC_2.3.4
GLIBC_2.4
GLIBC_2.5
GLIBC_2.6
GLIBC_2.7
GLIBC_2.8
GLIBC_2.9
GLIBC_2.10
GLIBC_2.11
GLIBC_2.12
GLIBC_2.13
GLIBC_2.14
GLIBC_2.15
GLIBC_2.16
GLIBC_2.17
GLIBC_PRIVATE
GLIBC_2.8
GLIBC_2.5
GLIBC_2.9
GLIBC_2.7
GLIBC_2.6
GLIBC_2.11
GLIBC_2.16
GLIBC_2.10
GLIBC_2.17
GLIBC_2.13
GLIBC_2.2.6
5.8.3.Grunt安装
进入到head-master目录下,并进行grunt安装
[root@localhost ~]# cd elasticsearch-head-master/
[root@localhost elasticsearch-head-master]# npm install grunt
npm WARN deprecated [email protected]: CoffeeScript on NPM has moved to "coffeescript" (no hyphen)
npm WARN prefer global [email protected] should be installed with -g
[email protected] /root/elasticsearch-head-master
└─┬ [email protected]
  ├── [email protected]
  ├─┬ [email protected]
  │ ├── [email protected]
  │ └─┬ [email protected]
  │   ├─┬ [email protected]
  │   │ └── [email protected]
  │   ├── [email protected]
  │   ├─┬ [email protected]
  │   │ ├─┬ [email protected]
  │   │ │ └── [email protected]
  │   │ └── [email protected]
  │   ├── [email protected]
  │   ├── [email protected]
  │   ├─┬ [email protected]
  │   │ ├── [email protected]
  │   │ ├─┬ [email protected]
  │   │ │ ├─┬ [email protected]
  │   │ │ │ └─┬ [email protected]
  │   │ │ │   └── [email protected]
  │   │ │ ├── [email protected]
  │   │ │ └── [email protected]
  │   │ ├── [email protected]
  │   │ └─┬ [email protected]
  │   │   ├─┬ [email protected]
  │   │   │ └── [email protected]
  │   │   └─┬ [email protected]
  │   │     └── [email protected]
  │   ├── [email protected]
  │   ├─┬ [email protected]
  │   │ ├─┬ [email protected]
  │   │ │ ├── [email protected]
  │   │ │ └─┬ [email protected]
  │   │ │   └── [email protected]
  │   │ └─┬ [email protected]
  │   │   ├─┬ [email protected]
  │   │   │ ├── [email protected]
  │   │   │ ├─┬ [email protected]
  │   │   │ │ └─┬ [email protected]
  │   │   │ │   └── [email protected]
  │   │   │ ├── [email protected]
  │   │   │ └─┬ [email protected]
  │   │   │   └── [email protected]
  │   │   └── [email protected]
  │   ├─┬ [email protected]
  │   │ ├─┬ [email protected]
  │   │ │ └─┬ [email protected]
  │   │ │   └── [email protected]
  │   │ └── [email protected]
  │   └── [email protected]
  ├── [email protected]
  ├── [email protected]
  ├─┬ [email protected]
  │ └── [email protected]
  ├─┬ [email protected]
  │ ├── [email protected]
  │ ├─┬ [email protected]
  │ │ └── [email protected]
  │ ├── [email protected]
  │ └── [email protected]
  ├─┬ [email protected]
  │ └── [email protected]
  ├── [email protected]
  ├─┬ [email protected]
  │ ├── [email protected]
  │ ├─┬ [email protected]
  │ │ ├─┬ [email protected]
  │ │ │ ├── [email protected]
  │ │ │ ├── [email protected]
  │ │ │ ├─┬ [email protected]
  │ │ │ │ └── [email protected]
  │ │ │ ├── [email protected]
  │ │ │ └── [email protected]
  │ │ └── [email protected]
  │ ├── [email protected]
  │ └── [email protected]
  ├─┬ [email protected]
  │ ├── [email protected]
  │ ├── [email protected]
  │ ├── [email protected]
  │ ├── [email protected]
  │ └─┬ [email protected]
  │   └── [email protected]
  ├─┬ [email protected]
  │ └── [email protected]
  ├─┬ [email protected]
  │ ├─┬ [email protected]
  │ │ └── [email protected]
  │ └── [email protected]
  ├─┬ [email protected]
  │ └─┬ [email protected]
  │   ├── [email protected]
  │   └── [email protected]
  ├─┬ [email protected]
  │ └── [email protected]
  ├── [email protected]
  └── [email protected]
配置软链接,并确认是否好用
[root@localhost elasticsearch-head-master]# ln -s /root/elasticsearch-head-master/node_modules/grunt/bin/grunt /usr/bin/
[root@localhost elasticsearch-head-master]# grunt -version
grunt-cli v1.2.0
grunt v1.0.1
下载安装其他依赖包
npm install grunt-contrib-clean --registry=https://registry.npm.taobao.org
npm install grunt-contrib-concat --registry=https://registry.npm.taobao.org
npm install grunt-contrib-watch --registry=https://registry.npm.taobao.org
npm install grunt-contrib-connect --registry=https://registry.npm.taobao.org
npm install grunt-contrib-copy --registry=https://registry.npm.taobao.org
npm install grunt-contrib-jasmine --registry=https://registry.npm.taobao.org
Grunt及依赖包安装后都可以在…/elasticsearch-head-master/node_modules/下找到
报错:
在npm install时出现如下报错
[root@localhost bin]# npm i nrm -g -verbose
npm info it worked if it ends with ok
npm verb cli [ '/root/node-v6.16.0-linux-x64/bin/node',
npm verb cli   '/usr/local/bin/npm',
npm verb cli   'i',
npm verb cli   'nrm',
npm verb cli   '-g',
npm verb cli   '-verbose' ]
npm info using [email protected]
npm info using [email protected]
npm verb request uri http://registry.npm.taobao.org/nrm
npm verb request no auth needed
npm info attempt registry request try #1 at 4:51:07 PM
npm verb request id 5f1185f6d6174800
npm verb etag W/"80a338a00e58e351bbb7d74f826f9763e536e62d"
npm http request GET http://registry.npm.taobao.org/nrm
npm info retry will retry, error on last attempt: Error: unexpected end of file
可通过清除缓存解决
npm cache clean --force
5.8.4.HEAD打包
Head下载链接:
https://codeload.github.com/mobz/elasticsearch-head/zip/refs/heads/master
修改elasticsearch-head的配置可以访问的源IP,配置文件路径为:
/root/elasticsearch-head-master/Gruntfile.js
             connect: {
                        server: {
                                options: {
                                        hostname: '0.0.0.0',
                                        port: 9100,
                                        base: '.',
                                        keepalive: true
                                }
                        }
                }
将/root/elasticsearch-head-master/和/root/node-v6.16.0-linux-x64/统一打包到es-head.tar.gz中
tar -cvzf es-head.tar.gz elasticsearch-head-master/ node-v6.16.0-linux-x64/
5.8.5.HEAD插件安装在内网服务器
将打包好的es-head.tar.gz上传到内网服务器nginx02的/data/install_packages/下,并进行解压
tar -zxvf /data/install_packages/es-head.tar.gz -C /data/
mv /data/node-v6.16.0-linux-x64/ /data/node
制作软链接
[root@nginx02 data]# ln -s /data/node/bin/node /usr/bin/node
[root@nginx02 data]# ln -s /data/node/bin/npm /usr/bin/npm
[root@nginx02 data]# node -v
v6.16.0
[root@nginx02 data]# npm -v
3.10.10
elasticsearch-head和elasticsearch是两个功能,如果互相访问,是跨域问题。解决跨域问题后才可以正常用elasticsearch-head管理elasticsearch。
修改elasticsearch的配置文件elasticsearch/config/elasticsearch.yml,在最后面添加:
http.cors.enabled: true
http.cors.allow-origin: "*"
重启elasticsearch服务
systemctl restart elasticsearch.service
systemctl status elasticsearch.service
启动elasticsearch-head服务
[root@nginx02 data]# su - es
[es@nginx02 data]# cd elasticsearch-head-master/
[es@nginx02 elasticsearch-head-master]# setsid grunt server
[es@nginx02 elasticsearch-head-master]# >> Local Npm module "grunt-contrib-jasmine" not found. Is it installed?

Running "connect:server" (connect) task
Waiting forever...
Started connect web server on http://localhost:9100
注:setsid grunt server表示后台运行,grunt server为前台运行
5.8.6.添加防火墙策略
将TCP/9100添加到防火墙白名单中
firewall-cmd --add-port=9100/tcp --permanent
systemctl restart firewalld
5.8.7.页面访问
访问链接为:
http://x.x.x.x:9100/?auth_user=elastic&auth_password=xxxxx

因为elasticsearch开启了用户名密码认证,因此不能直接访问http://x.x.x.x:9100/,会导致无法连接到es集群

第六章 Logstash安装配置
6.1.安装
解压安装包到/data/下
tar -zxvf /data/install_packages/logstash-8.9.1-linux-x86_64.tar.gz -C /data/
mv /data/logstash-8.9.1/ /data/logstash
将logstash目录归属修改为es用户
[root@nginx02 ~]# chown -R es:es /data/logstash/
[root@nginx02 ~]# ll -d /data/logstash/
drwxr-xr-x. 13 es es 4096 Aug 23 15:30 /data/logstash/
6.2.配置证书
从8.0开始需要为Logstash配置身份验证凭据才能建立通信。如果身份验证失败,Logstash会引发异常,并且处理管道将停止。
logstash不能够直接使用elasticsearch生成的PKCS#12类型的证书,需要用openssl命令去elastic-certificates.p12的证书中提取pem证书logstash-ca.pem,密码为空:
[es@nginx02 ~]$ openssl pkcs12 -in /data/elasticsearch/config/elastic-certificates.p12 -clcerts -nokeys -chain -out /data/logstash/logstash-ca.pem
Enter Import Password:
MAC verified OK
将其拷贝到/data/logstash/config/certs目录
[es@nginx02 ~]$ mkdir /data/logstash/config/certs
[es@nginx02 ~]$ cp /data/logstash/logstash-ca.pem /data/logstash/config/certs/
[es@nginx02 ~]$ chown -R es:es /data/logstash/
6.3.测试
6.3.1.stdin+stdout
使用logstash标准输入(stdin)输出(stdout)进行测试
创建测试配置文件
su - es
touch /data/logstash/config/test1.conf
内容如下:
input {
        stdin {}
}

filter {
        grok {
                match => { "message" => "%{IP:clientip} %{WORD:method} %{URIPATHPARAM:request} %{NUMBER:bytes} %{NUMBER:duration}" }
        }
}

output {
        stdout {
                codec => rubydebug
        }
}
用测试配置文件启动logstash进行测试
[es@nginx02 ~]$ /data/logstash/bin/logstash -f /data/logstash/config/test1.conf
Using bundled JDK: /data/logstash/jdk
Sending Logstash logs to /data/logstash/logs which is now configured via log4j2.properties
[2023-08-25T08:36:39,763][INFO ][logstash.runner ] Log4j configuration path used is: /data/logstash/config/log4j2.properties
[2023-08-25T08:36:39,769][INFO ][logstash.runner ] Starting Logstash {"logstash.version"=>"8.9.1", "jruby.version"=>"jruby 9.3.10.0 (2.6.8) 2023-02-01 107b2e6697 OpenJDK 64-Bit Server VM 17.0.8+7 on 17.0.8+7 +indy +jit [x86_64-linux]"}
[2023-08-25T08:36:39,771][INFO ][logstash.runner ] JVM bootstrap flags: [-Xms1g, -Xmx1g, -Djava.awt.headless=true, -Dfile.encoding=UTF-8, -Djruby.compile.invokedynamic=true, -XX:+HeapDumpOnOutOfMemoryError, -Djava.security.egd=file:/dev/urandom, -Dlog4j2.isThreadContextMapInheritable=true, -Djruby.regexp.interruptible=true, -Djdk.io.File.enableADS=true, --add-exports=jdk.compiler/com.sun.tools.javac.api=ALL-UNNAMED, --add-exports=jdk.compiler/com.sun.tools.javac.file=ALL-UNNAMED, --add-exports=jdk.compiler/com.sun.tools.javac.parser=ALL-UNNAMED, --add-exports=jdk.compiler/com.sun.tools.javac.tree=ALL-UNNAMED, --add-exports=jdk.compiler/com.sun.tools.javac.util=ALL-UNNAMED, --add-opens=java.base/java.security=ALL-UNNAMED, --add-opens=java.base/java.io=ALL-UNNAMED, --add-opens=java.base/java.nio.channels=ALL-UNNAMED, --add-opens=java.base/sun.nio.ch=ALL-UNNAMED, --add-opens=java.management/sun.management=ALL-UNNAMED]
[2023-08-25T08:36:39,914][WARN ][logstash.config.source.multilocal] Ignoring the 'pipelines.yml' file because modules or command line options are specified
/data/logstash/vendor/bundle/jruby/2.6.0/gems/sinatra-2.2.4/lib/sinatra/base.rb:938: warning: constant Tilt::Cache is deprecated
[2023-08-25T08:36:40,329][INFO ][logstash.agent ] Successfully started Logstash API endpoint {:port=>9600, :ssl_enabled=>false}
[2023-08-25T08:36:40,502][INFO ][org.reflections.Reflections] Reflections took 84 ms to scan 1 urls, producing 132 keys and 464 values
[2023-08-25T08:36:40,726][INFO ][logstash.javapipeline ] Pipeline `main` is configured with `pipeline.ecs_compatibility: v8` setting. All plugins in this pipeline will default to `ecs_compatibility => v8` unless explicitly configured otherwise.
[2023-08-25T08:36:40,737][WARN ][logstash.filters.grok ][main] ECS v8 support is a preview of the unreleased ECS v8, and uses the v1 patterns. When Version 8 of the Elastic Common Schema becomes available, this plugin will need to be updated
[2023-08-25T08:36:40,802][INFO ][logstash.javapipeline ][main] Starting pipeline {:pipeline_id=>"main", "pipeline.workers"=>8, "pipeline.batch.size"=>125, "pipeline.batch.delay"=>50, "pipeline.max_inflight"=>1000, "pipeline.sources"=>["/data/logstash/config/test.conf"], :thread=>"#" }
[2023-08-25T08:36:41,336][INFO ][logstash.javapipeline ][main] Pipeline Java execution initialization time {"seconds"=>0.53}
[2023-08-25T08:36:41,355][INFO ][logstash.javapipeline ][main] Pipeline started {"pipeline.id"=>"main"}
The stdin plugin is now waiting for input:
[2023-08-25T08:36:41,364][INFO ][logstash.agent ] Pipelines running {:count=>1, :running_pipelines=>[:main], :non_running_pipelines=>[]}
aaaaaaaaaaaa
{
"@timestamp" => 2023-08-25T00:36:47.619398760Z,
"@version" => "1",
"event" => {
"original" => "aaaaaaaaaaaa"
},
"tags" => [
[0] "_grokparsefailure"
],
"message" => "aaaaaaaaaaaa",
"host" => {
"hostname" => "nginx02"
}
}
1.1.1.1 GET /index.html 30 0.23
{
"method" => "GET",
"@timestamp" => 2023-08-25T00:37:16.582415968Z,
"@version" => "1",
"bytes" => "30",
"event" => {
"original" => "1.1.1.1 GET /index.html 30 0.23"
},
"duration" => "0.23",
"request" => "/index.html",
"message" => "1.1.1.1 GET /index.html 30 0.23",
"host" => {
"hostname" => "nginx02"
},
6.3.2.stdin+es
使用logstash标准输入(stdin)输出(elasticsearch)进行测试
创建测试配置文件
su - es
touch /data/logstash/config/test2.conf
内容如下:
input {
        stdin {}
}

filter {
        grok {
                match => { "message" => "%{IP:clientip} %{WORD:method} %{URIPATHPARAM:request} %{NUMBER:bytes} %{NUMBER:duration}" }
        }
}

output {
        elasticsearch {
                hosts => ["x.x.x.x:9200"]
                index => "nginx-access-%{+YYYY.MM.dd}"
                ssl_certificate_verification => true
                cacert => "/data/logstash/config/certs/logstash-ca.pem"
                user => "elastic"
                password => "xxxxxxx"
        }
}
用测试配置文件启动logstash进行测试
[es@nginx02 elasticsearch-head-master]$ /data/logstash/bin/logstash -f /data/logstash/config/test2.conf
Using bundled JDK: /data/logstash/jdk
Sending Logstash logs to /data/logstash/logs which is now configured via log4j2.properties
[2023-08-25T10:27:37,390][INFO ][logstash.runner ] Log4j configuration path used is: /data/logstash/config/log4j2.properties
[2023-08-25T10:27:37,396][INFO ][logstash.runner ] Starting Logstash {"logstash.version"=>"8.9.1", "jruby.version"=>"jruby 9.3.10.0 (2.6.8) 2023-02-01 107b2e6697 OpenJDK 64-Bit Server VM 17.0.8+7 on 17.0.8+7 +indy +jit [x86_64-linux]"}
[2023-08-25T10:27:37,398][INFO ][logstash.runner ] JVM bootstrap flags: [-Xms1g, -Xmx1g, -Djava.awt.headless=true, -Dfile.encoding=UTF-8, -Djruby.compile.invokedynamic=true, -XX:+HeapDumpOnOutOfMemoryError, -Djava.security.egd=file:/dev/urandom, -Dlog4j2.isThreadContextMapInheritable=true, -Djruby.regexp.interruptible=true, -Djdk.io.File.enableADS=true, --add-exports=jdk.compiler/com.sun.tools.javac.api=ALL-UNNAMED, --add-exports=jdk.compiler/com.sun.tools.javac.file=ALL-UNNAMED, --add-exports=jdk.compiler/com.sun.tools.javac.parser=ALL-UNNAMED, --add-exports=jdk.compiler/com.sun.tools.javac.tree=ALL-UNNAMED, --add-exports=jdk.compiler/com.sun.tools.javac.util=ALL-UNNAMED, --add-opens=java.base/java.security=ALL-UNNAMED, --add-opens=java.base/java.io=ALL-UNNAMED, --add-opens=java.base/java.nio.channels=ALL-UNNAMED, --add-opens=java.base/sun.nio.ch=ALL-UNNAMED, --add-opens=java.management/sun.management=ALL-UNNAMED]
[2023-08-25T10:27:37,544][WARN ][logstash.config.source.multilocal] Ignoring the 'pipelines.yml' file because modules or command line options are specified
/data/logstash/vendor/bundle/jruby/2.6.0/gems/sinatra-2.2.4/lib/sinatra/base.rb:938: warning: constant Tilt::Cache is deprecated
[2023-08-25T10:27:37,951][INFO ][logstash.agent ] Successfully started Logstash API endpoint {:port=>9600, :ssl_enabled=>false}
[2023-08-25T10:27:38,184][INFO ][org.reflections.Reflections] Reflections took 88 ms to scan 1 urls, producing 132 keys and 464 values
[2023-08-25T10:27:38,357][WARN ][logstash.outputs.elasticsearch] You are using a deprecated config setting "ssl_certificate_verification" set in elasticsearch. Deprecated settings will continue to work, but are scheduled for removal from logstash in the future. Set 'ssl_verification_mode' instead. If you have any questions about this, please visit the #logstash channel on freenode irc. {:name=>"ssl_certificate_verification", :plugin=>true, password=>, hosts=>[//x.x.x.x:9200], cacert=>"/data/logstash/config/certs/logstash-ca.pem", index=>"nginx-access-%{+YYYY.MM.dd}", id=>"6d5f19555500bcdc86e01b5a4b6da95761530e262ff5353ed51fb0802c52cc0e", user=>"elastic", enable_metric=>true, codec=>"plain_a8baf34a-4138-4b33-97a1-a802b35c1b2f", enable_metric=>true, charset=>"UTF-8">, workers=>1, ssl_verification_mode=>"full", sniffing=>false, sniffing_delay=>5, timeout=>60, pool_max=>1000, pool_max_per_route=>100, resurrect_delay=>5, validate_after_inactivity=>10000, http_compression=>false, retry_initial_interval=>2, retry_max_interval=>64, dlq_on_failed_indexname_interpolation=>true, data_stream_type=>"logs", data_stream_dataset=>"generic", data_stream_namespace=>"default", data_stream_sync_fields=>true, data_stream_auto_routing=>true, manage_template=>true, template_overwrite=>false, template_api=>"auto", doc_as_upsert=>false, script_type=>"inline", script_lang=>"painless", script_var_name=>"event", scripted_upsert=>false, retry_on_conflict=>1, ilm_enabled=>"auto", ilm_pattern=>"{now/d}-000001", ilm_policy=>"logstash-policy">}
[2023-08-25T10:27:38,359][WARN ][logstash.outputs.elasticsearch] You are using a deprecated config setting "cacert" set in elasticsearch. Deprecated settings will continue to work, but are scheduled for removal from logstash in the future. Set 'ssl_certificate_authorities' instead. If you have any questions about this, please visit the #logstash channel on freenode irc. {:name=>"cacert", :plugin=>true, password=>, hosts=>[//x.x.x.x:9200], cacert=>"/data/logstash/config/certs/logstash-ca.pem", index=>"nginx-access-%{+YYYY.MM.dd}", id=>"6d5f19555500bcdc86e01b5a4b6da95761530e262ff5353ed51fb0802c52cc0e", user=>"elastic", enable_metric=>true, codec=>"plain_a8baf34a-4138-4b33-97a1-a802b35c1b2f", enable_metric=>true, charset=>"UTF-8">, workers=>1, ssl_verification_mode=>"full", sniffing=>false, sniffing_delay=>5, timeout=>60, pool_max=>1000, pool_max_per_route=>100, resurrect_delay=>5, validate_after_inactivity=>10000, http_compression=>false, retry_initial_interval=>2, retry_max_interval=>64, dlq_on_failed_indexname_interpolation=>true, data_stream_type=>"logs", data_stream_dataset=>"generic", data_stream_namespace=>"default", data_stream_sync_fields=>true, data_stream_auto_routing=>true, manage_template=>true, template_overwrite=>false, template_api=>"auto", doc_as_upsert=>false, script_type=>"inline", script_lang=>"painless", script_var_name=>"event", scripted_upsert=>false, retry_on_conflict=>1, ilm_enabled=>"auto", ilm_pattern=>"{now/d}-000001", ilm_policy=>"logstash-policy">}
[2023-08-25T10:27:38,377][INFO ][logstash.javapipeline ] Pipeline `main` is configured with `pipeline.ecs_compatibility: v8` setting. All plugins in this pipeline will default to `ecs_compatibility => v8` unless explicitly configured otherwise.
[2023-08-25T10:27:38,387][INFO ][logstash.outputs.elasticsearch][main] New Elasticsearch output {:class=>"LogStash::Outputs::ElasticSearch", :hosts=>["//x.x.x.x:9200"]}
[2023-08-25T10:27:38,508][INFO ][logstash.outputs.elasticsearch][main] Elasticsearch pool URLs updated {:changes=>{:removed=>[], :added=>[http://elastic:[email protected]:9200/]}}
[2023-08-25T10:27:38,590][WARN ][logstash.outputs.elasticsearch][main] Restored connection to ES instance {:url=>"http://elastic:[email protected]:9200/"}
[2023-08-25T10:27:38,598][INFO ][logstash.outputs.elasticsearch][main] Elasticsearch version determined (8.9.1) {:es_version=>8}
[2023-08-25T10:27:38,599][WARN ][logstash.outputs.elasticsearch][main] Detected a 6.x and above cluster: the `type` event field won't be used to determine the document _type {:es_version=>8}
[2023-08-25T10:27:38,609][INFO ][logstash.outputs.elasticsearch][main] Not eligible for data streams because config contains one or more settings that are not compatible with data streams: {"index"=>"nginx-access-%{+YYYY.MM.dd}"}
[2023-08-25T10:27:38,610][INFO ][logstash.outputs.elasticsearch][main] Data streams auto configuration (`data_stream => auto` or unset) resolved to `false`
[2023-08-25T10:27:38,611][WARN ][logstash.filters.grok ][main] ECS v8 support is a preview of the unreleased ECS v8, and uses the v1 patterns. When Version 8 of the Elastic Common Schema becomes available, this plugin will need to be updated
[2023-08-25T10:27:38,620][INFO ][logstash.outputs.elasticsearch][main] Using a default mapping template {:es_version=>8, :ecs_compatibility=>:v8}
[2023-08-25T10:27:38,674][INFO ][logstash.javapipeline ][main] Starting pipeline {:pipeline_id=>"main", "pipeline.workers"=>8, "pipeline.batch.size"=>125, "pipeline.batch.delay"=>50, "pipeline.max_inflight"=>1000, "pipeline.sources"=>["/data/logstash/config/test2.conf"], :thread=>"#" }
[2023-08-25T10:27:39,179][INFO ][logstash.javapipeline ][main] Pipeline Java execution initialization time {"seconds"=>0.5}
[2023-08-25T10:27:39,201][INFO ][logstash.javapipeline ][main] Pipeline started {"pipeline.id"=>"main"}
The stdin plugin is now waiting for input:
[2023-08-25T10:27:39,240][INFO ][logstash.agent ] Pipelines running {:count=>1, :running_pipelines=>[:main], :non_running_pipelines=>[]}
bbbbbbbbbbbbbbbbbbbbbb
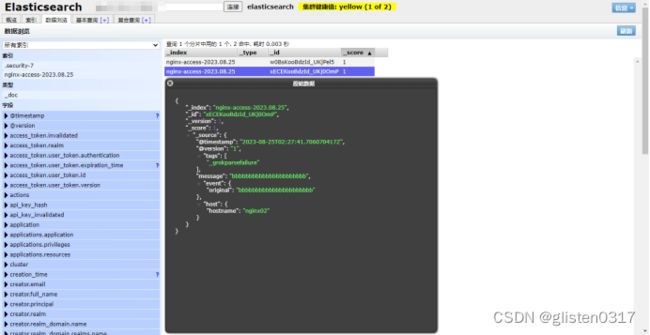
在head页面看输入内容传送到es中
6.4.配置conf文件
针对nginx日志新建配置文件
touch /data/logstash/config/logstash.conf
chown es:es /data/logstash/config/logstash.conf
修改配置文件内容
Input {
        beats {
                port => 5044
        }
}

output {
        elasticsearch {
                hosts => ["x.x.x.x:9200"]
                index => "nginx-access-%{+YYYY.MM.dd}"
                ssl_certificate_verification => true
                cacert => "/data/logstash/config/certs/logstash-ca.pem"
                user => "elastic"
                password => "xxxxxxxx"
        }
}
6.5.制作系统服务
将Logstash配置成系统服务,新建系统服务service文件
touch /usr/lib/systemd/system/logstash.service
配置系统服务文件内容
[Unit]
Description=logstash service
After=network.target remote-fs.target nss-lookup.target

[Service]
User=es
Type=forking
ExecStart=/data/logstash/bin/logstash -f /data/logstash/config/logstash.conf --path.logs /data/logstash/logs

[Install]
WantedBy=default.target
注:-f后面如果需要匹配多个conf文件,不能加*号,否则只会读取一个文件;可以在-f后面加上目录来实现。
启动Logstash服务
systemctl enable --now logstash.service
systemctl status logstash.service
6.6.配置防火墙
开启TCP:5044端口
firewall-cmd --add-port=5044/tcp --permanent
systemctl restart firewalld
第七章 Filebeat安装配置
需要在nginx01和nginx02上安装配置
7.1.安装
解压安装包到/data/下
tar -zxvf /data/install_packages/filebeat-8.9.1-linux-x86_64.tar.gz -C /data/
mv /data/filebeat-8.9.1-linux-x86_64/ /data/filebeat
7.2.配置
修改配置文件/data/filebeat/filebeat.yml
修改输入源为应用(nginx)日志路径和系统(messages)日志路径;注释掉输出到elasticsearch的配置;将输出配置为logstash
# ============================== Filebeat inputs ===============================

- type: log
  # Change to true to enable this input configuration.
  enabled: true

  # Paths that should be crawled and fetched. Glob based paths.
  paths:
    - /usr/local/nginx/logs/access.log
  tags: ["nginx-access"]

- type: log
  enabled: true
  paths:
    - /usr/local/nginx/logs/error.log
  tags: ["nginx-error"]

- type: log
  enabled: true
  paths:
    - /var/log/messages
  tags: ["system-message"]
# ---------------------------- Elasticsearch Output ----------------------------
#output.elasticsearch:
#  hosts: ["localhost:9200"]

# ------------------------------ Logstash Output -------------------------------
output.logstash:
  # The Logstash hosts
  hosts: ["x.x.x.x:5044"]
7.3.制作系统服务
将Filebeat配置成系统服务,新建系统服务service文件
touch /usr/lib/systemd/system/filebeat.service
配置系统服务文件内容
[Unit]
Description=Filebeat
Documentation=https://www.elastic.co/guide
After=network.target

[Service]
Type=simple
Restart=always
ExecStart=/data/filebeat/filebeat -c /data/filebeat/filebeat.yml

[Install]
WantedBy=multi-user.target
启动Filebeat服务
systemctl enable --now filebeat.service
systemctl status filebeat.service
7.4.测试
通过访问nginx上的服务,在head上观察收集日志情况
第八章 Kibana安装配置
8.1.安装
解压安装包到/data/下
tar -zxvf /data/install_packages/kibana-8.9.1-linux-x86_64.tar.gz -C /data/
mv /data/kibana-8.9.1/ /data/kibana
8.2.配置
在es中新建一个用于kibana登录用的账号elklogin,密码xxxxxx
[es@nginx02 ~]$ /data/elasticsearch/bin/elasticsearch-users useradd elklogin
Enter new password:
Retype new password:
[es@nginx02 ~]$ /data/elasticsearch/bin/elasticsearch-users roles -a superuser elklogin
[es@nginx02 ~]$ /data/elasticsearch/bin/elasticsearch-users roles -a kibana_system elklogin
修改配置文件/data/kibana/config/kibana.yml
# =================== System: Kibana Server ===================
# Kibana is served by a back end server. This setting specifies the port to use.
server.port: 5601

# Specifies the address to which the Kibana server will bind. IP addresses and host names are both valid values.
# The default is 'localhost', which usually means remote machines will not be able to connect.
# To allow connections from remote users, set this parameter to a non-loopback address.
server.host: "x.x.x.x"

# =================== System: Elasticsearch ===================
# The URLs of the Elasticsearch instances to use for all your queries.
elasticsearch.hosts: ["http://x.x.x.x:9200"]

# If your Elasticsearch is protected with basic authentication, these settings provide
# the username and password that the Kibana server uses to perform maintenance on the Kibana
# index at startup. Your Kibana users still need to authenticate with Elasticsearch, which
# is proxied through the Kibana server.
elasticsearch.username: "elklogin"
elasticsearch.password: "xxxxxx"

# =================== System: Other ===================
# Specifies locale to be used for all localizable strings, dates and number formats.
# Supported languages are the following: English (default) "en", Chinese "zh-CN", Japanese "ja-JP", French "fr-FR".
i18n.locale: "zh-CN"
8.3.制作系统服务
将Filebeat配置成系统服务,新建系统服务service文件
touch /usr/lib/systemd/system/kibana.service
配置系统服务文件内容
[Unit]
Description=Kibana
After=network.target

[Service]
User=es
ExecStart=/data/kibana/bin/kibana
Type=simple
Restart=always

[Install]
WantedBy=default.target
启动Filebeat服务
systemctl enable --now kibana.service
systemctl status kibana.service
8.4.添加防火墙策略
将TCP/5601增加至防火墙策略中
firewall-cmd --add-port=5601/tcp --permanent
systemctl restart firewalld
8.5.测试
kibana页面链接为:http://x.x.x.x:5601/
用户名:elklogin,密码:xxxxxxx
报错:
启动kibana时出现报错
[es@nginx02 ~]$ /data/kibana/bin/kibana
[2023-08-27T12:54:02.859+08:00][INFO ][node] Kibana process configured with roles: [background_tasks, ui]
[2023-08-27T12:54:14.543+08:00][INFO ][plugins-service] Plugin "cloudChat" is disabled.
[2023-08-27T12:54:14.549+08:00][INFO ][plugins-service] Plugin "cloudExperiments" is disabled.
[2023-08-27T12:54:14.549+08:00][INFO ][plugins-service] Plugin "cloudFullStory" is disabled.
[2023-08-27T12:54:14.550+08:00][INFO ][plugins-service] Plugin "cloudGainsight" is disabled.
[2023-08-27T12:54:14.667+08:00][INFO ][plugins-service] Plugin "profiling" is disabled.
[2023-08-27T12:54:14.690+08:00][INFO ][plugins-service] Plugin "serverless" is disabled.
[2023-08-27T12:54:14.690+08:00][INFO ][plugins-service] Plugin "serverlessObservability" is disabled.
[2023-08-27T12:54:14.690+08:00][INFO ][plugins-service] Plugin "serverlessSearch" is disabled.
[2023-08-27T12:54:14.691+08:00][INFO ][plugins-service] Plugin "serverlessSecurity" is disabled.
[2023-08-27T12:54:14.815+08:00][FATAL][root] Error: [config validation of [elasticsearch].username]: value of "elastic" is forbidden. This is a superuser account that cannot write to system indices that Kibana needs to function. Use a service account token instead. Learn more: https://www.elastic.co/guide/en/elasticsearch/reference/8.0/service-accounts.html
    at ensureValidConfiguration (/data/kibana/node_modules/@kbn/core-config-server-internal/src/ensure_valid_configuration.js:23:11)
    at Server.preboot (/data/kibana/node_modules/@kbn/core-root-server-internal/src/server.js:154:5)
    at Root.preboot (/data/kibana/node_modules/@kbn/core-root-server-internal/src/root/index.js:46:14)
    at bootstrap (/data/kibana/node_modules/@kbn/core-root-server-internal/src/bootstrap.js:89:9)
    at Command.<anonymous> (/data/kibana/src/cli/serve/serve.js:179:5)

 FATAL  Error: [config validation of [elasticsearch].username]: value of "elastic" is forbidden. This is a superuser account that cannot write to system indices that Kibana needs to function. Use a service account token instead. Learn more: https://www.elastic.co/guide/en/elasticsearch/reference/8.0/service-accounts.html
原因是因为es不允许使用elastic用户登录kibana,因此需要创建一个自定义用户。
第九章 配置日志解析规则
9.1.过滤器插件
Filter是Logstash功能强大的主要原因,它可以对Logstash Event进行丰富的处理,比如说解析数据、删除字段、类型转换等等,常见的有如下几个:
- Date:时间解析
- grok:正则匹配解析
- dissect:分割符解析
- mutate:对字段做处理,比如重命名、删除、替换等
- json:按照json解析字段内容到指定字段中
- geoip:增加地理位置数据
- ruby:利用ruby代码来动态修改Logstash Event
9.1.1.date插件
从字段解析日期以用作事件的Logstash时间戳,以下配置解析名为logdate的字段以设置Logstash时间戳:
filter {
  date {
    match => [ "logdate", "MMM dd yyyy HH:mm:ss" ]
  }
}
返回结果
{"logdate":"Jan 01 2018 12:02:03"}
{
      "@version" => "1",
          "host" => "Node2",
    "@timestamp" => 2018-01-01T04:02:03.000Z,
       "logdate" => "Jan 01 2018 12:02:03"
}
match:类型为数组,用于指定日期匹配的格式,可以一次指定多种日志格式
match => [ "logdate", "MMM dd yyyy HH:mm:ss" ,"MMM d yyyy HH:mm:ss","ISO8601"]
target:类型为字符串,用于指定赋值的字段名,默认是@timestamp
timezone:类型为字符串,用于指定时区
9.1.2.grok插件
将非结构化事件数据分析到字段中。 这个工具非常适用于系统日志,Apache和其他网络服务器日志,MySQL日志,以及通常为人类而不是计算机消耗的任何日志格式。
以下配置将消息解析为字段:
filter {
  grok {
    match => { "message" => "%{IP:client} %{WORD:method} %{URIPATHPARAM:request} %{NUMBER:bytes} %{NUMBER:duration}" }
  }
}
应用过滤器后,示例中的事件将具有以下字段:
client: 55.3.244.1
method: GET
request: /index.html
bytes: 15824
duration: 0.043
Grok语法:
%{SYNTAX:SEMANTIC} # SYNTAX为grok pattern的名称,SEMANTIC为赋值字段名称
%{NUMBER:duration} #可以匹配数值类型,但是grok匹配出的内容都是字符串类型,可以通过在最后指定为int或者float来强制转换类型
%{NUMBER:duration:float}
常见pattern可以查看:GitHub或者logstash家目录下的:
vendor/bundle/jruby/2.3.0/gems/logstash-patterns-core-
4.1.2/patterns
自定义匹配规则:
格式:(?
pattern_definitions参数,以键值对的方式定义pattern名称和内容
pattern_dir参数,以文件的形式被读取
filter{
    grok {
        match => {"message"=>"%{SERVICE:service}"}
        pattern_definitions => {"SERVICE" => "[a-z0-9]{10,11}"}
        #patterns_dir => ["/opt/logstash/patterns", "/opt/logstash/extra_patterns"]
    }
}
tag_on_failure: 默认是_grokparsefailure,可以基于此做判断。
9.1.3.dissect插件
基于分隔符原理解析数据,解决grok解析时消耗过多cpu资源的问题。
使用分隔符将非结构化事件数据提取到字段中。解剖过滤器不使用正则表达式,速度非常快。但是,如果数据的结构因行而异,grok过滤器更合适。
dissect的应用有一定的局限性:主要适用于每行格式相似且分隔符明确简单的场景
dissect语法比较简单,有一系列字段(field)和分隔符(delimiter)组成
%{}字段
%{}之间是分隔符
例如,假设日志中包含以下消息:
Apr 26 12:20:02 localhost systemd[1]: Starting system activity accounting tool...
以下配置解析消息:
filter {
  dissect {
    mapping => { "message" => "%{ts} %{+ts} %{+ts} %{src} %{prog}[%{pid}]: %{msg}" }
  }
}
解剖过滤器应用后,事件将被解剖到以下领域:
{
  "msg"        => "Starting system activity accounting tool...",
  "@timestamp" => 2017-04-26T19:33:39.257Z,
  "src"        => "localhost",
  "@version"   => "1",
  "host"       => "localhost.localdomain",
  "pid"        => "1",
  "message"    => "Apr 26 12:20:02 localhost systemd[1]: Starting system activity accounting tool...",
  "type"       => "stdin",
  "prog"       => "systemd",
  "ts"         => "Apr 26 12:20:02"
}
说明
Apr 26 12:20:02
%{ts} %{+ts} %{+ts}     #+代表该匹配值追加到ts字段下
{
    "ts":"Apr 26 12:20:02"
}

two three one go
%{+order/2} %{+order/3} %{+order/1} %{+order/4}     #/后面的数字代表拼接的次序
{
    "order": "one two three go"
}

a=1&b=2
%{?key1}=%{&key1}&%{?key2}=%{&key2}  #%{?}代表忽略匹配值,但是富裕字段名,用于后续匹配用;%{&}代表将匹配值赋予key1的匹配值
{
    "a":"1",
    "b":"2"
}

#dissect可以自动处理空的匹配值
John Smith,Big Oaks,Wood Lane,Hambledown,Canterbury,CB34RY
%{name},%{addr1},%{addr2},%{addr3},%{city},%{zip}

Jane Doe,4321 Fifth Avenue,,,New York,87432
{
    "name":"Jane Doe",
    "addr1":"4321 Fifth Avenue",
    "addr2":"",
    "addr3":"",
    "city":"New York",
    "zip":"87432"
}

#dissect分割后的字段值都是字符串,可以使用convert_datatype属性进行类型转换
filter{
    dissect{
        convert_datatype => {age => "int"}
    }
}
9.1.4.mutate插件
使用最频繁的操作,可以对字段进行各种操作,比如重命名、删除、替换、更新等,主要操作如下:
| 操作 | 说明 |
|---|---|
| convert | 类型转换 |
| gsub | 字符串替换 |
| split/join/merge | 字符串切割、数组合并为字符串、数字合并为数组 |
| rename | 字段重命名 |
| update/replace | 字段内容更新或替换 |
| remove_field | 删除字段 |
- convert:实现字段类型的转换,类型为hash,仅支持转换为integer、float、string和Boolean
filter{
    mutate{
        convert => {"age" => "integer"}
    }
}
- gsub:对字段内容进行替换,类型为数组,每3项为一个替换配置
filter {
  mutate {
    gsub => [
      # replace all forward slashes with underscore
      "fieldname", "/", "_",
      # replace backslashes, question marks, hashes, and minuses
      # with a dot "."
      "fieldname2", "[\\?#-]", "."
    ]
  }
}
- Split:将字符串切割为数组
filter {
  mutate {
     split => { "fieldname" => "," }
  }
}
- join:将数组拼接为字符串
- merge:将两个数组合并为1个数组,字符串会被转为1个元素的数组进行操作
- rename:字段重命名
- update/replace:更新字段内容,区别在于update只在字段存在时生效,而replace在字段不存在时会执行新增字段的操作
filter {
  mutate {
    update => { "sample" => "My new message" }
    update => { "message" => "source from c:%{source_host}" }   #%{source_host}可以引用logstash Event中的字段值
  }
}
9.1.5.geoip插件
常用的插件,根据ip地址提供对应的地域信息,比如经纬度、城市名等,方便进行地理数据分析。
filter {
  geoip {
    source => "clientip"
  }
}
9.1.6.ruby插件
最灵活的插件,可以以ruby语言来随心所欲的修改Logstash Event对象。
filter{
    ruby{
        code => 'size = event.get("message").size;
                event.set("message_size",size)'
    }
}

ruby {
        code => "event.set('@read_timestamp',event.get('@timestamp'))"
}
参考链接:https://blog.csdn.net/wfs1994/article/details/80862952
9.2.Logstash解析规则
Access日志
原始日志字段都存在message中
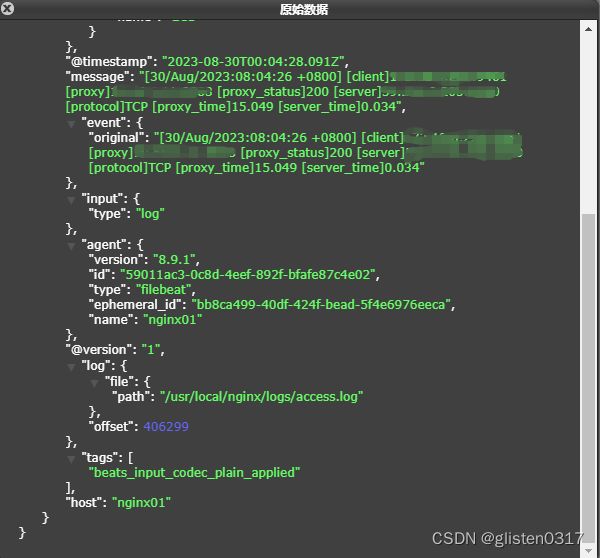
可以通过kibana界面中的Grok Debugger工具进行调试

根据nginx日志格式,grok语句如下:
\[%{HTTPDATE:log_time}\] \[client\]%{IP:client_ip}\:%{NUMBER:client_port} \[proxy\]%{IP:proxy_ip}\:%{NUMBER:proxy_port} \[proxy_status\]%{NUMBER:proxy_status} \[server\]%{IP:server_ip}\:%{NUMBER:server_port} \[protocol\]%{WORD:protocol} \[upstream_duration\]%{NUMBER:upstream_duration} \[client2proxy\]%{NUMBER:client-proxy} \[proxy2client\]%{NUMBER:proxy-client} \[proxy2server\]%{NUMBER:proxy-server} \[server2proxy\]%{NUMBER:server-proxy}
Error日志
通过kibana界面中的Grok Debugger工具进行调试

根据nginx日志格式,grok语句如下:
(?<error_time>%{YEAR}[./-]%{MONTHNUM}[./-]%{MONTHDAY}[- ]%{TIME}) \[%{WORD:log_level}\] %{GREEDYDATA:error_info}
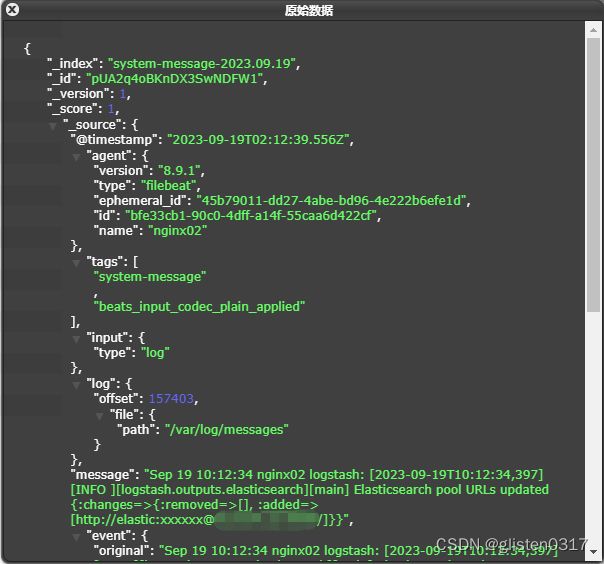
系统日志
通过kibana界面中的Grok Debugger工具进行调试

根据系统日志格式,grok语句如下:
%{SYSLOGTIMESTAMP:syslog_timestamp} %{SYSLOGHOST:syslog_hostname} %{DATA:syslog_program}(?:)?: %{GREEDYDATA:syslog_message}
修改/data/logstash/config/logstash.conf文件
input {
        beats {
                port => 5044
                host => "0.0.0.0"
        }
}

filter {
        if "nginx-access" in [tags] {
                mutate {
                        rename => { "[host][name]" => "host" }
                }
                grok {
                        match => {
                                "message" => "\[%{HTTPDATE:access_time}\] \[client\]%{IP:client_ip}\:%{NUMBER:client_port} \[proxy\]%{IP:proxy_ip}\:%{NUMBER:proxy_port} \[proxy_status\]%{NUMBER:proxy_status} \[server\]%{IP:server_ip}\:%{NUMBER:server_port} \[protocol\]%{WORD:protocol} \[upstream_duration\]%{NUMBER:upstream_duration} \[client2proxy\]%{NUMBER:client-proxy} \[proxy2client\]%{NUMBER:proxy-client} \[proxy2server\]%{NUMBER:proxy-server} \[server2proxy\]%{NUMBER:server-proxy}"
                        }
                }
                ruby {
                        code => "event.set('access_time', event.get('@timestamp'))"
                }
                date {
                        match => ["timestamp", "yyyy-MM-dd HH:mm:ss"]
                        target => "@timestamp"
                }
        }
        if "nginx-error" in [tags] {
                mutate {
                        rename => { "[host][name]" => "host" }
                }
                grok {
                        match => {
                                "message" => "(?%{YEAR}[./-]%{MONTHNUM}[./-]%{MONTHDAY}[- ]%{TIME}) \[%{WORD:log_level}\] (?%{NUMBER}[.#-]%{NUMBER}[.:-][. -][.*-]%{NUMBER}) (?%{WORD}[.\(-][.\)-][. -]%{WORD}) \(%{GREEDYDATA:err_info}\) while connecting to upstream, client\: %{IP:err_client}, server\: (?%{IP}[.:-]%{NUMBER}), upstream\: \"(?%{IP}[.:-]%{NUMBER})\", %{GREEDYDATA:err_byte_1}, %{GREEDYDATA:err_byte_2}"
                        }
                }
                ruby {
                        code => "event.set('error_time', event.get('@timestamp'))"
                }
                date {
                        match => ["timestamp", "yyyy-MM-dd HH:mm:ss"]
                        target => "@timestamp"
                }
        }
        if "system-message" in [tags] {
                mutate {
                        rename => { "[host][name]" => "host" }
                }
                grok {
                        match => {
                                "message" => "%{SYSLOGTIMESTAMP:syslog_timestamp} %{SYSLOGHOST:syslog_hostname} %{DATA:syslog_program}(?:)?: %{GREEDYDATA:syslog_message}"
                        }
                }
        }
}
output {
        if "nginx-access" in [tags] {
                elasticsearch {
                        hosts => ["x.x.x.x:9200"]
                        index => "nginx-access-%{+YYYY.MM.dd}"
                        ssl_certificate_verification => true
                        cacert => "/data/logstash/config/certs/logstash-ca.pem"
                        user => "elastic"
                        password => "xxxxxxxxx"
                }
        }
        if "nginx-error" in [tags] {
                elasticsearch {
                        hosts => ["x.x.x.x:9200"]
                        index => "nginx-error-%{+YYYY.MM.dd}"
                        ssl_certificate_verification => true
                        cacert => "/data/logstash/config/certs/logstash-ca.pem"
                        user => "elastic"
                        password => "xxxxxxxxx"
                }
        }
        if "system-message" in [tags] {
                elasticsearch {
                        hosts => ["x.x.x.x:9200"]
                        index => "system-message-%{+YYYY.MM.dd}"
                        ssl_certificate_verification => true
                        cacert => "/data/logstash/config/certs/logstash-ca.pem"
                        user => "elastic"
                        password => "xxxxxxxxx"
                }
        }
}
重启logstash服务
systemctl restart logstash.service
systemctl status logstash.service
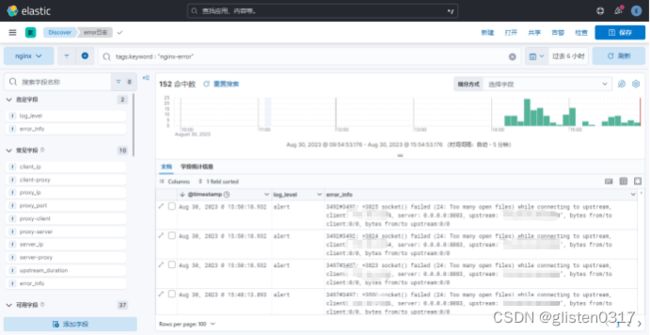
再次查看日志字段,已经按照解析到相应字段中


9.3.Kibana呈现视图
创建视图

Access日志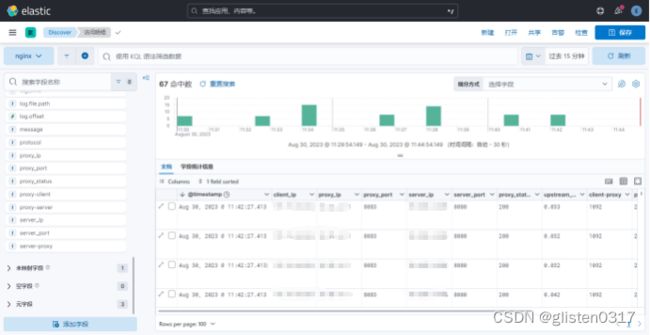
Error日志
监控视图

系统message日志
第十章 Metricbeat安装配置
10.1.安装
解压安装包到/data/下
tar -zxvf /data/install_packages/metricbeat-7.17.13-linux-x86_64.tar.gz -C /data/
mv /data/metricbeat-7.17.13-linux-x86_64/ /data/metricbeat
10.2.配置
修改配置文件/data/metricbeat/metricbeat.yml
# ================================= Dashboards =================================
# 加载默认模板
setup.dashboards.enabled: true
# 如果存在模板,则不覆盖原有模板
setup.template.overwrite: false

# =================================== Kibana ===================================
setup.kibana:
  host: "x.x.x.x:5601"

# ================================== Outputs ===================================
# Configure what output to use when sending the data collected by the beat.
# ---------------------------- Elasticsearch Output ----------------------------
output.elasticsearch:
  # 输出到elasticsearch
  hosts: ["x.x.x.x:9200"]
  logging.level: debug
  username: "elastic"
  password: "xxxxxxxxxx"
# ================================== Logging ===================================
logging.level: debug
10.3.相关指令
10.3.1.启动/禁止模块
默认开启的是system module
[root@nginx01 metricbeat]# ./metricbeat modules list
Enabled:
system

Disabled:
activemq
aerospike
airflow
apache
appsearch
aws
awsfargate
azure
beat
beat-xpack
ceph
ceph-mgr
cloudfoundry
cockroachdb
consul
coredns
couchbase
couchdb
docker
dropwizard
elasticsearch
elasticsearch-xpack
enterprisesearch
envoyproxy
etcd
gcp
golang
graphite
haproxy
http
ibmmq
iis
istio
jolokia
kafka
kibana
kibana-xpack
kubernetes
kvm
linux
logstash
logstash-xpack
memcached
mongodb
mssql
munin
mysql
nats
nginx
openmetrics
oracle
php_fpm
postgresql
prometheus
rabbitmq
redis
redisenterprise
sql
stan
statsd
syncgateway
tomcat
traefik
uwsgi
vsphere
windows
zookeeper
如果想启用或禁用模块,执行如下命令
./metricbeat modules enable oracle
./metricbeat modules disable kafka
10.3.2.模块配置
各个模块配置以yml文件形式存储在/data/metricbeat/modules.d/
以system为例,从配置可以看出采集的metricset属性、采集频率等
# Module: system
# Docs: https://www.elastic.co/guide/en/beats/metricbeat/7.17/metricbeat-module-system.html

- module: system
  period: 10s
  metricsets:
    - cpu
    - load
    - memory
    - network
    - process
    - process_summary
    - socket_summary
    #- entropy
    #- core
    #- diskio
    #- socket
    #- service
    #- users
  process.include_top_n:
    by_cpu: 5      # include top 5 processes by CPU
    by_memory: 5   # include top 5 processes by memory
# Configure the mount point of the host’s filesystem for use in monitoring a host from within a container
#system.hostfs: "/hostfs"

- module: system
  period: 1m
  metricsets:
    - filesystem
    - fsstat
  processors:
  - drop_event.when.regexp:
      system.filesystem.mount_point: '^/(sys|cgroup|proc|dev|etc|host|lib|snap)($|/)'

- module: system
  period: 15m
  metricsets:
    - uptime

#- module: system
#  period: 5m
#  metricse
#    - raid
#  raid.mount_point: '/'
10.3.3.测试模块可用性
以测试system模块为例
[root@nginx01 metricbeat]# ./metricbeat test modules system | grep OK
  cpu...OK
  load...OK
  memory...OK
  network...OK
  process...OK
  process_summary...OK
  filesystem...OK
  fsstat...OK
  uptime...OK
也可以针对某个metricset进行测试
[root@nginx01 metricbeat]# ./metricbeat test modules system cpu
system...
  cpu...OK
    result:
    {
     "@timestamp": "2023-09-19T07:13:31.568Z",
     "event": {
      "dataset": "system.cpu",
      "duration": 170892,
      "module": "system"
     },
     "host": {
      "cpu": {
       "usage": 0.0018
      }
     },
     "metricset": {
      "name": "cpu",
      "period": 10000
     },
     "service": {
      "type": "system"
     },
     "system": {
      "cpu": {
       "cores": 8,
       "idle": {
        "norm": {
         "pct": 0.9982
        },
        "pct": 7.9855
       },
       "iowait": {
        "norm": {
         "pct": 0
        },
        "pct": 0.0001
       },
       "irq": {
        "norm": {
         "pct": 0
        },
        "pct": 0
       },
       "nice": {
        "norm": {
         "pct": 0
        },
        "pct": 0
       },
       "softirq": {
        "norm": {
         "pct": 0.0001
        },
        "pct": 0.001
       },
       "steal": {
        "norm": {
         "pct": 0
        },
        "pct": 0
       },
       "system": {
        "norm": {
         "pct": 0.0015
        },
        "pct": 0.0123
       },
       "total": {
        "norm": {
         "pct": 0.0018
        },
        "pct": 0.0144
       },
       "user": {
        "norm": {
         "pct": 0.0001
        },
        "pct": 0.0012
       }
      }
     }
    }

system...OK
system...OK
10.4.启动
10.4.1.加载dashboard
第一次启动需要将metricbeat加载到Kibana仪表板中,如果已经加载过,则不用执行此步。
./metricbeat setup
执行后可以在kibana的dashboard中看到metricbeat自带的仪表板模板
10.4.2.制作系统服务
将Metricbeat配置成系统服务,新建系统服务service文件
touch /usr/lib/systemd/system/metricbeat.service
配置系统服务文件内容
[Unit]
Description=Metricbeat
Documentation=https://www.elastic.co/guide
After=network.target

[Service]
Type=simple
Restart=always
ExecStart=/data/metricbeat/metricbeat -e -c /data/metricbeat/metricbeat.yml

[Install]
WantedBy=multi-user.target
启动Metricbeat服务
systemctl enable --now metricbeat.service
systemctl status metricbeat.service
在nginx02上执行相同操作
10.5.界面
默认加载的dashboard比较多,本次只用[Metricbeat System] Host overview ECS,其余的可以删掉,如果需要用可以再次从metricbeat中加载

