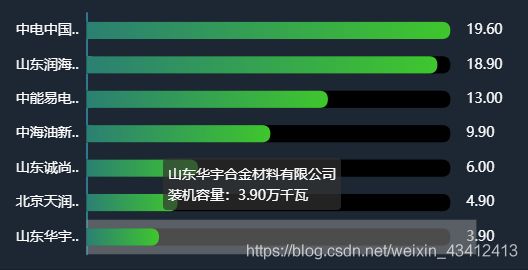
echarts柱状图横向 名字过长时显示省略号
实现效果:
var data = ["19.60", "18.90", "13.00", "9.90", "6.00", "4.90", "3.90"];
var yName = ["中电中国风xxxxx", "山东润海风xxxx", "中能易电新xxxx", "中海油新能xxx", "山东诚尚能xxxx", "北京天润新xxxx公司", "山东华宇合金xxxx公司"];

var max = [data[0], data[0], data[0], data[0], data[0], data[0], data[0]];

initEchartEleRank("groupInsBar", yName.reverse(), data.reverse(), max)

function initEchartEleRank(id, yName, value, valueMax) {

    let myChart = echarts.init(document.getElementById(id));

    myChart.clear();
    myChart.showLoading(); //数据加载完之前先显示一段简单的loading动画

    let option = {
        tooltip: {
            trigger: 'axis',
            show: true,
            formatter: (params)=> {
                // console.log('params', params)
                return params[0].name + `
 ` + `装机容量:` +  params[0].value + `万千瓦`;
            },
            axisPointer: {
                type: 'shadow'
            }
        },
        grid: {
            left: '3%',
            right: '3%',
            bottom: '2%',
            width: '92%',
            height: '100%',
            top: "2%",
            containLabel: true
        },
        xAxis: {
            show: false,
            type: 'value',
            boundaryGap: [0, 0.01]
        },
        yAxis: [{
            type: 'category',
            data: yName,
            axisLabel: {
                show: true,
                // 强制显示所有标签
                interval: 0,
                textStyle: {
                    color: "#fff",
                    fontSize: 14
                },
                formatter: function(value) {
                    var res = value;
                    // 长度超过4个的以省略号显示
                    if(res.length > 5) {
                        res = res.substring(0, 4) + "..";
                    }
                    return res;
                }
            },
            axisLine: {
                show: true,
                lineStyle: {
                    color: '#2F798e',
                    width: 2, //这里是为了突出显示加上的
                }
            },
            // 隐藏x轴刻度
            axisTick: {
                show: false
            }
        },
        {
           type: 'category',
            data: value,
            axisLabel: {
                show: true,
                margin: -10,
                // 强制显示所有标签
                interval: 0,
                textStyle: {
                    color: "#fff",
                    fontSize: 14
                }
            },
            axisLine: {
                show: false,
                lineStyle: {
                    color: '#2F798e',
                    width: 2, //这里是为了突出显示加上的
                }
            },
            // 隐藏x轴刻度
            axisTick: {
                show: false
            }
        }],
        series: [
        {
            name: '',
            type: 'bar',
            barGap: '-100%',
            zlevel: 10,
            // data: [1000,2344,2566,2890,3000,3500,4000],
            data: value,
            barWidth: '50%',
            itemStyle: {
                normal: {
                    color: new echarts.graphic.LinearGradient(1, 0, 0, 0, [
                            {
                                offset: 0,
                                color: '#3FC62D'
                            },
                            {
                                offset: 1,
                                color: '#2B8072'
                            }
                        ]),
                    // 设置柱状图的圆角  上右下左
                    barBorderRadius: [0, 10, 10, 0]
                }
            },
        },
        {
            name: '',
            type: 'bar',
            // data: [20, 20, 20, 20, 20, 20, 20],
            data: valueMax,
            barWidth: '50%',
            itemStyle: {
                normal: {
                    color: "#000",
                    barBorderRadius: [0, 10, 10, 0]
                }
            },
        }]
    };

    // 使用刚指定的配置项和数据显示图表。
    myChart.setOption(option);
    myChart.hideLoading(); //隐藏加载动画
}