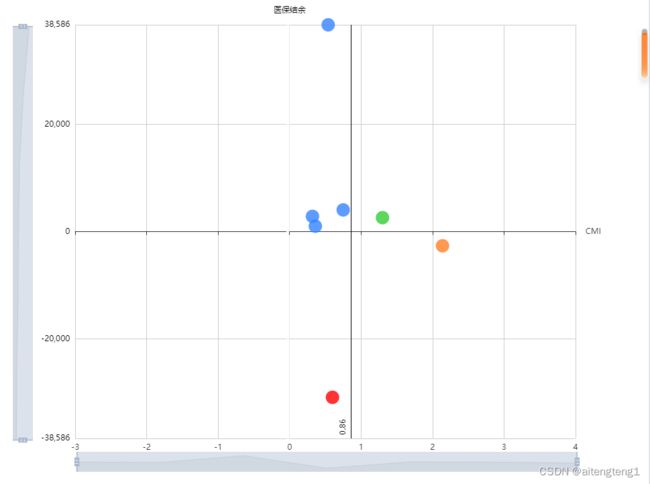
echarts散点图(象限图)设置不同的颜色
如图所示:
<template>
    <div ref="sdtcmijy" :style="{height:scrollerHeight}"></div>
</template>
<script>
import {getXxt} from './../requestAPI.js'

export default {
    data(){
        return {
            params:{},
            seriesData:[],
            xmin:0,
            scrollerHeight: document.body.clientHeight - 170 + "px",
        }
    },
    methods:{
        reset(){
            this.seriesData=[];
        },
        init(params){
            this.reset();
            this.params=params;
            this.search();
        },
        search(){
            getXxt(this.params).then(res=>{
                if(res.status===200){
                    let data=res.data.list.list;
                    this.xmin=res.data.xmin;
                    console.log(this.xmin)
                    if(data.length>0){
                        data.forEach(item => {
                            let obj=[item.fcmi,item.fybjy];
                            let val = { name: item.name, value: obj };
                            this.seriesData.push(val);
                        });
                        this.seriesData = this.seriesData.map(d => ({
                            ...d,
                            itemStyle: {

                                color: this.getAreaPointColor(d.value)
                            }
                        }))

                    }
                     this.initCharts();

                }
            });
        },
        getAreaPointColor (value) {
            console.log(value)
            let [x, y] = value
            if(x >= this.xmin && y >= 0){
                return '#32CD32	'
            }else if(x < this.xmin && y >= 0){

                return '#3583FF'
            }else if(x < this.xmin && y < 0){
                return '#FF0000	'
            }else if(x >= this.xmin && y < 0){
                return '#FF7F24'
            }

        },
        initCharts(){
            let that=this;
            let chartDom = this.$refs.sdtcmijy;
            let myChart = this.$echarts.init(chartDom);
            let option;

            option = {
                toolbox: {
                feature: {
                    saveAsImage: {},
                },
                },
                tooltip: {
                    position: "top",
                    formatter: "名称: {b}
" + "数值" + ": {c}",
                    },
            xAxis: {
                name:"x轴",
                type:'value',
                scale: true,
                min: function (value) {
                    if (Math.abs(value.min) > Math.abs(value.max)) {
                    return Math.floor(-Math.abs(value.min));
                    } else {
                    return Math.floor(-value.max);
                    }
                },
                max:function (value) {
                    if (Math.abs(value.min) > Math.abs(value.max)) {
                    return Math.ceil((that.xmin-(Math.floor(-Math.abs(value.min))))-(Math.ceil(Math.abs(value.min))-that.xmin)+Math.abs(value.min))
                    ;
                    } else {
                    return Math.ceil((that.xmin-(Math.floor(-value.max)))-(Math.ceil(value.max)-that.xmin)+value.max)
                    ;
                    }
                },
            },
            yAxis: {
                name:"y轴",
                type:'value',
                min: function (value) {
                    if (Math.abs(value.min) > Math.abs(value.max)) {
                    return Math.floor(-Math.abs(value.min));
                    } else {
                    return Math.floor(-value.max);
                    }
                },
                max: function (value) {
                    if (Math.abs(value.min) > Math.abs(value.max)) {
                    return Math.ceil(Math.abs(value.min));
                    } else {
                    return Math.ceil(value.max);
                    }
                },
                axisLine: {
                    lineStyle: {
                        color: '#E8E8E8', // 设置坐标轴颜色
                    }
                },
                axisLabel:{
                    color:'#000',

                },
                nameTextStyle:{
                    color:'#000',
                }
            },
            dataZoom: [
          {
            //滚动条
            bottom: 10,
            id: "dataZoomX",
            type: "slider",
            xAxisIndex: [0],
            filterMode: "filter",
            start: 0,
            end: 100,
          },
          {
            //滚动条
            left: 0,
            id: "dataZoomY",
            type: "slider",
            yAxisIndex: [0],
            filterMode: "filter",
            start: 0,
            end: 100,
          },
        ],
            series: [
                {
                name: "名称",
                symbolSize: 20,
                data: this.seriesData,
                type: 'scatter',
                markLine: {
                    label:{
                        show:true,
                        position:'insideStartTop'
                    },
                    symbol:[],
                    lineStyle: {
                            color: '#000',
                            type: "solid"
                        },
                data: [
                            {

                                xAxis: this.xmin
                            }
                        ]
                }

                }
            ]
            };

            option && myChart.setOption(option);
        }
    }
}
</script>
<style scoped>

</style>