搭建ELK-B日志收集
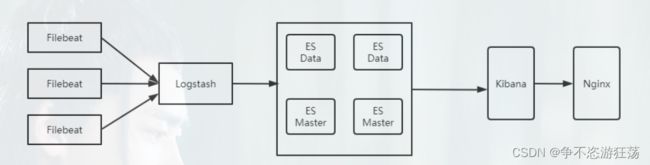
ELK-B架构介绍
ELK分别表示Elasticsearch、Logstash、Kibana,是一套完整的日志收集以及展示的解决方案。新增了一个FileBeat,是一个轻量型的日志收集处理工具,FileBeat占用的资源少,适合在各个服务器上搜集日志后传输给Logstash;
Elasticsearch简称ES,是一个基于Lucene的、支持全文索引的分布式存储和索引引擎,提供搜集、分析、存储数据三大功能,特点是具备分布式、零配置、自动发现、索引自动分片、索引副本机制、restFul风格接口、多数据源、自动搜索负载等。主要负责将日志索引存储起来,方便业务搜索查询;
Logstash是一个具有实时传输能力的数据收集引擎,是日志收集、过滤、转发的中间件,支持大量的数据获取方式,一般工作方式为C/S架构,client端安装在需要收集日志的主机上,Server端负责将收到的各节点日志进行过滤、修改等操作在一并发往elasticsearch上去,主要负责将各条业务线的各类日志统一收集、过滤后、转发给ES进行下一步的处理;
Kibana提供给了ES和Logstash一个友好的可视化Web界面,可以帮助汇总、分析和搜索重要数据汇总,可以在ES的索引中查找,交互数据,并且生成各种纬度表格;
FileBeat,是一个轻量级的开源日志文件数据搜集器,基于Logstash-Forwarder源代码开发,在需要采集的Server上安装FileBeat,并且指定日志目录或者日志文件后,FileBeat就能读取数据,迅速发送到Logstash进行解析,也可以直接发送到ES中进行集中式的存储和分析;
一.Elasticsearch安装
(1).操作系统调优(必须配置,否则ES起不来)
【1】内存优化
在/etc/sysctl.conf添加如下内容
fs.file-max=655360
vm.max_map_count=655360
刷新生效
sysctl -p
解释:
(1)vm.max_map_count=655360
系统最大打开文件描述符数
(2)vm.max_map_count=655360
限制一个进程拥有虚拟内存区域的大小
【2】修改
vim /etc/security/limits.conf
-
* soft nofile 65536
* hard nofile 65536
* soft nproc 65536
* hard nproc 65536
* soft memlock unlimited
* hard memlock unlimited
解释:
(nofile)最大开打开文件描述符
(nproc)最大用户进程数
(memlock)最大锁定内存地址空间
(2)新建文件夹并上传elasticsearch文件
mkdir /opt/elasticsearch
tar -zxvf elasticsearch-7.4.2-linux-x86_64.tar.gz
(3)修改es配置文件
vim ./config/elasticsearch.yml
cluster.name: my-application    # 集群名称

node.name: node-1        # 节点名称,仅仅是描述名称,用于在日志中区分
# Path to directory where to store the data (separate multiple locations by comma):
#
path.data: /opt/elasticsearch/data                 # 数据的默认存放路径
#
# Path to log files:
#
path.logs: /opt/elasticsearch/logs                  # 日志的默认存放路径

#
# Set the bind address to a specific IP (IPv4 or IPv6):
#
network.host: 0.0.0.0
#
# Set a custom port for HTTP:
#
http.port: 9200
#
# Pass an initial list of hosts to perform discovery when this node is started:
# The default list of hosts is ["127.0.0.1", "[::1]"]
#
discovery.seed_hosts: ["172.31.0.24"]  #集群个节点IP地址
#
# Bootstrap the cluster using an initial set of master-eligible nodes:
#
cluster.initial_master_nodes: ["node-1"] #master节点资格
#
# For more information, consult the discovery and cluster formation module documentation.
(4)添加elasticsearch启动用户
adduser es //创建一个账号为 es的用户
chown -R es:es /opt/elasticsearch/ //给es用户赋予操作此文件夹的权限
su es // 使用 es账户操作,如果是 su root 意为使用 root用户操作
(5)安装ik分词器
在/opt/elasticsearch/elasticsearch/plugins下新建ik文件夹
mkdir /opt/elasticsearch/elasticsearch/plugins/ik
将elasticsearch-analysis-ik-7.4.2.zip上传到ik文件夹下并解压
yum install -y unzip       //下载unzip命令

unzip elasticsearch-analysis-ik-7.4.2.zip    //解压文件夹
bin目录下查看已经加载的插件
./elasticsearch-plugin list
(6)启动es
在elasticsearch的bin目录下
//需要用es用户启动

./elasticsearch        //前台启动
./elasticsearch -d    //后台启动
http://127.0.0.1:9200/_cat/nodes?v&s=index     //查看节点信息

http://127.0.0.1:9200/_cat/indices?v    //查看索引信息
二.kibana安装
(1)上传安装包 解压并改名
tar -zxvf kibana-7.4.2-linux-x86_64.tar.gz
mv ./kibana-7.4.2  /kibana
chown -R es:es /opt/kibana
(2)配置config/kibana.yml
server.port: 5601   //端口

# Specifies the address to which the Kibana server will bind. IP addresses and host names are both valid values.
# The default is 'localhost', which usually means remote machines will not be able to connect.
# To allow connections from remote users, set this parameter to a non-loopback address.
server.host: "0.0.0.0"     //允许来自远程用户的连接

server.name: "my_kibana"     //服务名称

# The URLs of the Elasticsearch instances to use for all your queries.
elasticsearch.hosts: ["http://172.31.0.24:9200"]  //elasticsearch地址

# Specifies locale to be used for all localizable strings, dates and number formats.
# Supported languages are the following: English - en , by default , Chinese - zh-CN .
i18n.locale: "zh-CN"    //中文
(3)启动kibana
su  es  //使用es用户启动

bin/kibana   //前台启动

nohup  bin/kibana  &   //后台启动
三.安装logstash
(1)上传安装包 解压并改名
tar -zxvf /opt/elasticsearch/logstash-7.4.2.tar.gz
cd /opt/elasticsearch/logstash-7.4.2
(2)新建config/收集nginx接口日志
vim nginxtest.conf
input{
  file{
      path => "/var/log/nginx/access.log" # 想要收集的日志信息文件-注意全路径
      type=>"logstash_log"              # 指定一个类型
      start_position =>"beginning"      # 说明从文件最开始读
  }
}

#@timestamp比当前时间慢8小时
filter {
    ruby {
        code => "event.set('timestamp', event.get('@timestamp').time.localtime + 8*60*60)"
    }

    ruby {
        code => "event.set('@timestamp',event.get('timestamp'))"
    }

    mutate {
        remove_field => ["timestamp"]
    }
}
##@timestamp比当前时间快8小时
#修改kibana当前时区 GMT+0 (默认获取浏览器时间)


output{
    elasticsearch{                      # 配置elasticsearch接收数据信息
    hosts=>["http://127.0.0.1:9200"]           # 配置elasticsearch端口信息
    index=>"log-%{+YYYY.MM.dd}"         # 配置Kibana新建index,比如我这里是”log-“开头,在Kibana可以写”log-*”
    #使用自定义索引模板
    template => "/opt/elasticsearch/logstash-7.4.2/nginxtest.json"
    template_name => "log-*"
    template_overwrite => true

    }
}
(3)新建json文件/nginxtest.json
Elasticsearch-7x版本的基本模板
https://github.com/logstash-plugins/logstash-output-elasticsearch/blob/main/lib/logstash/outputs/elasticsearch/templates/ecs-disabled/elasticsearch-7x.json
Es为单节点生成日志索引副本数默认是1,新建的索引会有未分配碎片
vim nginxtest.json
{
  "index_patterns" : "log-*",
  "version" : 60001,
  "settings" : {
    "index.refresh_interval" : "5s",
    "index.number_of_replicas" : 0,     //副本数改为0
    "number_of_shards": 1
  },
  "mappings" : {
    "dynamic_templates" : [ {
      "message_field" : {
        "path_match" : "message",
        "match_mapping_type" : "string",
        "mapping" : {
          "type" : "text",
          "norms" : false
        }
      }
    }, {
      "string_fields" : {
        "match" : "*",
        "match_mapping_type" : "string",
        "mapping" : {
          "type" : "text", "norms" : false,
          "fields" : {
            "keyword" : { "type": "keyword", "ignore_above": 256 }
          }
        }
      }
    } ],
    "properties" : {
      "@timestamp": { "type": "date"},
      "@version": { "type": "keyword"},
      "geoip"  : {
        "dynamic": true,
        "properties" : {
          "ip": { "type": "ip" },
          "location" : { "type" : "geo_point" },
          "latitude" : { "type" : "half_float" },
          "longitude" : { "type" : "half_float" }
        }
      }
    }
  }
}
(4)启动logstash
./bin/logstash -f nginxtest.conf -t   //检查配置文件是否正确

./bin/logstash -f nginxtest.conf    //启动logstash
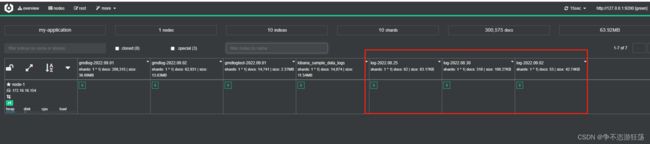
四、查看索引信息

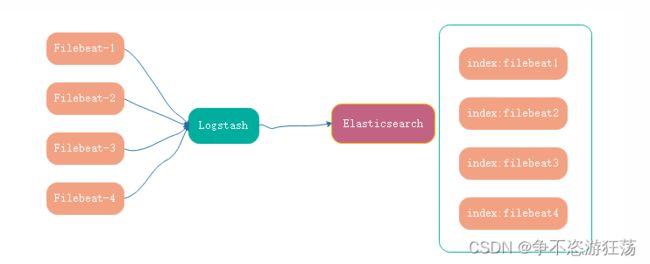
五、安装filebeat
服务器上常常跑着不同的服务且不止一台服务器的情况下,收集这些log时候,通常会需要定义成不同的索引。因此需要对收集的日志进行区分。
(1)下载安装包
filebeat-7.4.2-linux-x86_64.tar.gz
(2)修改配置文件
#=========================== Filebeat inputs =============================

filebeat.inputs:

# Each - is an input. Most options can be set at the input level, so
# you can use different inputs for various configurations.
# Below are the input specific configurations.

- type: log

  # Change to true to enable this input configuration.
  enabled: true

  # Paths that should be crawled and fetched. Glob based paths.
  paths:
    - /var/log/*.log
    #- c:\programdata\elasticsearch\logs\*


    fields:    ##可选字段,选择额外的字段进行输出可以是标量值,元组,字典等嵌套类型
  #  level: debug
  #  review: 1
     filetype: sys        #自定义类型用于logstash区分


#============================= Filebeat modules ===============================

filebeat.config.modules:
  # Glob pattern for configuration loading
  path: ${path.config}/modules.d/*.yml

  # Set to true to enable config reloading
  reload.enabled: false

  # Period on which files under path should be checked for changes
  #reload.period: 10s

#==================== Elasticsearch template setting ==========================

setup.template.settings:
  index.number_of_shards: 1
  #index.codec: best_compression
  #_source.enabled: false

#----------------------------- Logstash output --------------------------------
output.logstash:
  # The Logstash hosts
  hosts: ["localhost:5044"]

  # Optional SSL. By default is off.
  # List of root certificates for HTTPS server verifications
  #ssl.certificate_authorities: ["/etc/pki/root/ca.pem"]

  # Certificate for SSL client authentication
  #ssl.certificate: "/etc/pki/client/cert.pem"

  # Client Certificate Key
  #ssl.key: "/etc/pki/client/cert.key"
#=========================== 调优 =============================
## 调优 避免 占用内存过大
## 是否因为通配符的原因,造成同时监控数量巨大的文件
## 是否文件的单行内容巨大,日志记录不规范
## 是否output经常阻塞,event queue里面总是一直缓存event
max_procs: 1
queue.mem.events: 256
queue.mem.flush.min_events: 128
(3)启动filebeat
#查看启用或禁用模块:
./filebeat modules list
#启用logstash模块
./filebeat modules enable logstash
#检查配置文件是否正确
./filebeat test config
#启动filebeat
nohup ./filebeat -e -c filebeat-log.yml >/dev/null 2>&1 &
(4)将filebeat加入到服务
1.通过nohup方式启动filebeat,运行一段时间后filebeat自动退出。
原因是filebeat默认会定期检测文件是否有新的内容,如果超过一定时间检测的文件没有任务新日志写入,那么filebeat会自动退出,解决办法就是将filebeat通过系统后台的方式长期运行。
vim /etc/systemd/system/filebeat.service
[Unit]
Description=Filebeat is a lightweight shipper for metrics.
Documentation=https://www.elastic.co/products/beats/filebeat
Wants=network-online.target
After=network-online.target

[Service]
Environment="LOG_OPTS=-e"
Environment="CONFIG_OPTS=-c /opt/elasticsearch/filebeat-7.4.2-linux-x86_64/filebeat.yml"
Environment="PATH_OPTS=-path.home /opt/elasticsearch/filebeat-7.4.2-linux-x86_64/filebeat -path.config /opt/elasticsearch/filebeat-7.4.2-linux-x86_64 -path.data /opt/elasticsearch/filebeat-7.4.2-linux-x86_64/data -path.logs /opt/elasticsearch/filebeat-7.4.2-linux-x86_64/logs"
ExecStart=/opt/elasticsearch/filebeat-7.4.2-linux-x86_64/filebeat $LOG_OPTS $CONFIG_OPTS $PATH_OPTS
Restart=always

[Install]
WantedBy=multi-user.target
2.给该文件给予可执行的权限:
chmod +x /etc/systemd/system/filebeat.service
3.系统后台服务方式启动:
# 依次执行下列命令
systemctl daemon-reload
systemctl enable filebeat
systemctl start filebeat
(5)多filebeat配置方式
input{
    beats{
       port  => 5044
#      type => "beats"
 }

    file{
      path => "/var/log/nginx/access.log" # 想要收集的日志信息文件-注意全路径
      type=>"nginxlog"              # 指定一个类型
      start_position =>"beginning"      # 说明从文件最开始读
  }


}


filter {
    ruby {
        code => "event.set('timestamp', event.get('@timestamp').time.localtime + 8*60*60)"
    }

    ruby {
        code => "event.set('@timestamp',event.get('timestamp'))"
    }

    mutate {
        remove_field => ["timestamp"]
    }

#   if[type] == "beats" {
#        mutate {
#              add_tag => ["beats"]
#          }
#    }

    if [type] == "nginxlog" {
        mutate {
            add_tag => ["nginxlog"]
        }

	grok  {
      match => { "message" => "%{COMBINEDAPACHELOG}" }
       }

    }

}


output{
    if [fields][filetype] == "sys"  {
    elasticsearch{                      # 配置elasticsearch接收数据信息
    hosts=>["http://127.0.0.1:9200"]           # 配置elasticsearch端口信息
    index=>"elkblog-%{+YYYY.MM.dd}"         # 配置Kibana新建index,比如我这里是”log-“开头,在Kibana可以写”log-*”
    #使用自定义索引模板
    template => "/opt/elasticsearch/logstash-7.4.2/elkb.json"
    template_name => "elkblog-*"
    template_overwrite => true
    }
}

    if "nginxlog" in [tags] {
    elasticsearch{                      # 配置elasticsearch接收数据信息
    hosts=>["http://127.0.0.1:9200"]           # 配置elasticsearch端口信息
    index=>"log-%{+YYYY.MM.dd}"         # 配置Kibana新建index,比如我这里是”log-“开头,在Kibana可以写”log-*”
    #使用自定义索引模板
    template => "/opt/elasticsearch/logstash-7.4.2/nginxtest.json"
    template_name => "log-*"
    template_overwrite => true

    }
}


    if  [fields][filetype] == "blys" {
    elasticsearch{                      # 配置elasticsearch接收数据信息
    hosts=>["http://127.0.0.1:9200"]           # 配置elasticsearch端口信息
    index=>"blyslog-%{+YYYY.MM.dd}"         # 配置Kibana新建index,比如我这里是”log-“开头,在Kibana可以写”log-*”
    #使用自定义索引模板
    template => "/opt/elasticsearch/logstash-7.4.2/elkb.json"
    template_name => "elkblog-*"
    template_overwrite => true
    }
  }

}
六、定时清理日志索引
(1)编写清理es索引脚本
#!/bin/bash
time=$(date -d '-30days' +'%Y.%m.%d')
curl -XDELETE http://localhost:9200/*log-${time}

//保留日志索引一个月
(2)加入定时任务
crontab -e
20 01 * * * . /etc/profile;/bin/sh /opt/elasticsearch/deleteesindex.sh > /dev/null 2>&1