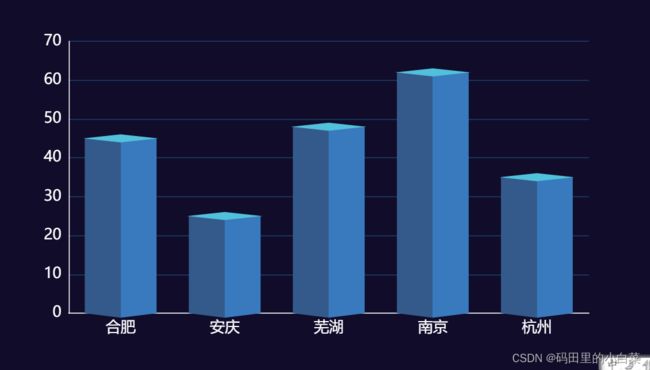
echarts实现3D柱状图
效果如图
let setData = function(data, constData, showData) {
			data.filter(function(item) {
				if (item) {
					constData.push(1);
					showData.push(item);
				} else {
					constData.push(0);
					showData.push({
						value: 1,
						itemStyle: {
							normal: {
								borderColor: "rgba(0,0,0,0)",
								borderWidth: 2,
								color: "rgba(0,0,0,0)",
							},
						},
					});
				}
			});
		}
		//组织颜色
		let setColor = function(colorArr) {
			let color = {
				type: "linear",
				x: 0,
				x2: 1,
				y: 0,
				y2: 0,
				/* 此处决定阴暗面 若为横向柱状图则x,y轴调换
					x: 0,
					x2: 0,
					y: 0,
					y2: 1, */
				colorStops: [{
						offset: 0,
						color: colorArr[0],
					},
					{
						offset: 0.5,
						color: colorArr[0],
					},
					{
						offset: 0.5,
						color: colorArr[1],
					},
					{
						offset: 1,
						color: colorArr[1],
					},
				],
			};
			return color
		}
		var vehicle = [45, 25, 48, 62, 35]
		var barWidth = 30;
		var constData1 = [];
		var showData1 = [];
		setData(vehicle, constData1, showData1)
		var colorArr1 = ["#345A8B", "#387ABD", "#51C0DB"];
		var color1 = setColor(colorArr1)

option = {
   tooltip: {
				trigger: 'axis',
				axisPointer: {
					type: 'shadow'
				}
			},
			legend: {
				show: false
			},
			grid: {
				top: '15%',
				bottom: '15%'
			},
			xAxis: {
				type: 'category',
				axisLabel: {
					color: '#FFFFFF',
					fontSize:16
				},
				axisLine: {
					show: true,
					lineStyle: {
						color: '#fff'
					}
				},
				axisTick: {
					show: false
				},
				data:  ['合肥', '安庆', '芜湖', '南京', '杭州']
			},
			yAxis: {
				type: 'value',
				axisLabel: {
					color: '#FFFFFF',
					fontSize:16
				},
				axisLine: {
					show: true,
					lineStyle: {
						color: '#fff'
					}
				},
				splitLine: {
					lineStyle: {
						color: '#1B3F66'
					}
				}
			},
			series: [
			  {
					z: 1,
					type: 'bar',
					name: '柱子1',
					barGap: "15%", //相邻柱子间距
					itemStyle: {
						borderRadius: [0, 0, 0, 0],//柱子四周圆角
						color: color1//柱子左右颜色(深,浅)
					},
					data: vehicle //Y轴上的高度
				},
				{
					z: 2,
					name: '柱子1',
					type: "pictorialBar",
					data: constData1,//此数据对应底部组件
					symbol: "diamond",//底部组件形状,不写默认为椭圆
					symbolOffset: ["0%", "50%"],//与柱子的偏移角度
					symbolSize: [80, 10],//底面[宽,高]
					itemStyle: {
						normal: {
							color: color1//底面左右颜色(深,浅)
						},
					},
					tooltip: {
						show: false,
					},
				},
				{
					z: 3,
					name: '',
					type: "pictorialBar",
					symbolPosition: "end",
					data: showData1,//此数据对应顶部组件
					symbol: "diamond",
					symbolOffset: ["0%", "-50%"],
					symbolSize: [barWidth - -50, (10 * (barWidth - 4)) / barWidth],
					itemStyle: {
						normal: {
							color: colorArr1[2]
						},
					},
					tooltip: {
						show: false,
					},
				}
			]
};