vue3 echarts实现k线
文章目录
-
-
- echarts实现k线
- 核心代码
- 完整代码
-
echarts实现k线
安装
npm install echarts
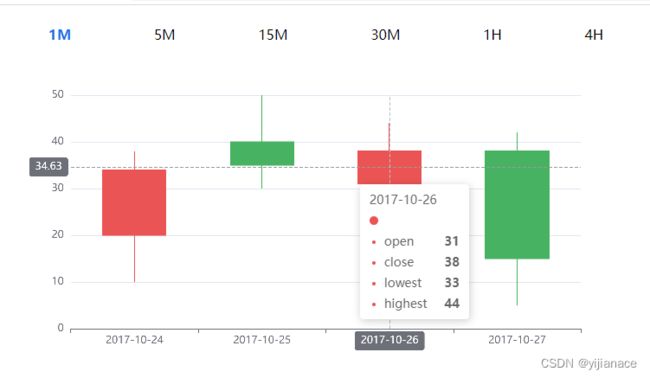
实现效果
没有添加成交量和均线

核心代码
引入echarts
echartsData表示echarts数据
这样写是为了方便点击时间切换k线数据
window.addEventListener(“resize”, () => {
chart.resize();
});
当屏幕大小切换之后自动切换图表大小
import * as echarts from "echarts";

const echartsData = ref([
  {
    time: "1M",
    data: [
      [20, 34, 10, 38],
      [40, 35, 30, 50],
      [31, 38, 33, 44],
      [38, 15, 5, 42],
    ],
  },
  {
    time: "5M",
    data: [
      [25, 30, 20, 35],
      [45, 36, 32, 48],
      [33, 39, 31, 45],
      [37, 14, 4, 41],
    ],
  },
  {
    time: "15M",
    data: [
      [33, 39, 31, 45],
      [37, 14, 4, 41],
      [22, 32, 18, 36],
      [42, 37, 29, 47],
    ],
  },
  {
    time: "30M",
    data: [
      [31, 38, 33, 44],
      [38, 15, 5, 42],
      [25, 30, 20, 35],
      [45, 36, 32, 48],
    ],
  },
  {
    time: "1H",
    data: [
      [33, 39, 31, 45],
      [37, 14, 4, 41],
      [22, 32, 18, 36],
      [42, 37, 29, 47],
    ],
  },
  {
    time: "4H",
    data: [
      [30, 45, 28, 50],
      [50, 38, 35, 55],
      [53, 45, 35, 48],
      [52, 42, 38, 49],
    ],
  },
]);

let chart;

onMounted(() => {
  chart = echarts.init(chart_box.value);
  option && chart.setOption(option);

  window.addEventListener("resize", () => {
    chart.resize();
  });
});
完整代码
<script setup>
import * as echarts from "echarts";
import { ref, onMounted } from "vue";

const chart_box = ref(null);

const active = ref("1M");

const echartsData = ref([
  {
    time: "1M",
    data: [
      [20, 34, 10, 38],
      [40, 35, 30, 50],
      [31, 38, 33, 44],
      [38, 15, 5, 42],
    ],
  },
  {
    time: "5M",
    data: [
      [25, 30, 20, 35],
      [45, 36, 32, 48],
      [33, 39, 31, 45],
      [37, 14, 4, 41],
    ],
  },
  {
    time: "15M",
    data: [
      [33, 39, 31, 45],
      [37, 14, 4, 41],
      [22, 32, 18, 36],
      [42, 37, 29, 47],
    ],
  },
  {
    time: "30M",
    data: [
      [31, 38, 33, 44],
      [38, 15, 5, 42],
      [25, 30, 20, 35],
      [45, 36, 32, 48],
    ],
  },
  {
    time: "1H",
    data: [
      [33, 39, 31, 45],
      [37, 14, 4, 41],
      [22, 32, 18, 36],
      [42, 37, 29, 47],
    ],
  },
  {
    time: "4H",
    data: [
      [30, 45, 28, 50],
      [50, 38, 35, 55],
      [53, 45, 35, 48],
      [52, 42, 38, 49],
    ],
  },
]);

const option = {
  tooltip: {
    trigger: "axis",
    axisPointer: {
      type: "cross",
    },
  },
  xAxis: {
    data: ["2017-10-24", "2017-10-25", "2017-10-26", "2017-10-27"],
  },
  yAxis: {},
  series: [
    {
      type: "candlestick",
      data: echartsData.value[0].data,
    },
  ],
};

let chart;

onMounted(() => {
  chart = echarts.init(chart_box.value);
  option && chart.setOption(option);

  window.addEventListener("resize", () => {
    chart.resize();
  });
});

const goTime = (item) => {
  active.value = item.time;
  option.series[0].data = item.data;
  chart.setOption(option)
};
</script>

<template>
  <div class="chart">
    <div class="time">
      <span
        v-for="(item, index) in echartsData"
        :key="index"
        @click="goTime(item)"
        :class="active === item.time ? 'active' : ''"
        >{{ item.time }}</span
      >
    </div>
    <div
      class="chart_box"
      ref="chart_box"
      style="width: 100%; height: 400px"
    ></div>
  </div>
</template>

<style lang="scss" scoped>
.chart {
  padding: 15px 0px;
}
.time {
  display: flex;
  justify-content: space-around;
}
.active {
  color: #1a73e8;
  font-weight: 600;
}
</style>