Python学习笔记:JSON格式
# -*- coding: utf-8 -*-
"""
Created on Sun Mar 15 21:46:59 2020
@author: 86159
"""
#use #%% to create cells;Run current cell(ctrl+enter)
#%%
#json.dump()函数的使用,将json信息写进文件 with open(filename,'w') as f: json.dump(data,f)
#json.load()函数的使用,将读取json信息 with open(filename,'r') as f: xx=json.load(f)
#json.dumps()函数的使用,将一个Python数据类型列表进行json格式的编码(将字典转化为字符串)
#json.loads()函数的使用,将json格式数据转换为python对象(将字符串转化为字典)
#%%
#btc_close_2017.json文件中的数据是一个很长的python列表,每个元素都是一个包含五个键的字典
from urllib.request import urlopen
import json
json_url="https://raw.githubusercontent.com/muxuezi/btc/master/btc_close_2017.json"
#URLError:
response=urlopen(json_url)#返回对象类型是http.client.HTTPResponse;HttpResponse是一个类似于文件的对象
#print(str(type(response)))#
#读取数据
req=response.read()#方法read()从文件中读取所有内容,返回值是字符串
#print(req)
#将数据写入文件,若此文件不存在则创建再写入
with open('btc_close_2017_urllin.json','wb') as f:#以二进制格式打开一个文件只用于写入。如果该文件已存在则将其覆盖。如果该文件不存在,创建新文件。
f.write(req)
#加载json格式;将文件内容转换成python能够处理的格式
file_urllib=json.loads(req)#√#json.load(req):'bytes' object has no attribute 'read':由于使用的json内置函数不同,一个是load另一个是loads。
print(file_urllib)
#%%
#函数urlopen的代码稍微复杂一些,第三方模块requests封装了许多常用的方法,让数据下载和读取方式变得非常简单
import requests
json_url="https://raw.githubusercontent.com/muxuezi/btc/master/btc_close_2017.json"
req=requests.get(json_url)#通过get方法向GitHub服务器发送请求,服务器响应请求后,返回的结果存储在req变量中
#构造一个向服务器请求资源的Request对象(Request),并且get方法返回一个包含服务器资源的Response对象
#print(str(type(req)))#
#req.headers#http响应内容的头部内容,来返回get请求获得网页的头部信息。
#req.status_code#http请求的返回状态,200表示连接成功,404表示连接失败
#req.text#http响应内容的字符串形式,url对应的页面内容
#req.encoding#从HTTP header中猜测的响应内容编码方式
#req.apparent_encoding#从内容分析出的响应内容的编码方式(备选编码方式)
#req.content#HTTP响应内容的二进制形式
#将数据写入文件
with open('btc_close_2017_request.json','w') as f:
f.write(req.text)#
file_requests=req.json()#将btc_close_2017.json文件数据转换成python列表file_requests
print(file_requests)
#%%
#提取相关数据
import json
filename="btc_close_2017.json"
#把数据加载到一个列表中,btc_data为列表类型,每个元素是一个包含五个键-值对的字典
with open(filename) as f:
btc_data=json.load(f)#json.load()函数的使用,将读取json信息
# {
# "date": "2017-01-01",
# "month": "01",
# "week": "52",
# "weekday": "Sunday",
# "close": "6928.6492"
# }
#打印每一天的信息
for btc_dict in btc_data:
date=btc_dict['date']
month=btc_dict['month']
week=btc_dict['week']
weekday=btc_dict['weekday']
close=btc_dict['close']
print("{} is month {} week {},{},the close price is {} RMB".format(date,month,week,weekday,close))
#%%
#将字符串转换为数字值,绘制收盘价折线图--matplotlib
#如字符串s="123"--s=int(s)--s=123
#如字符串ss="123.45"--ss=float(ss)--ss=123.45;若取整,ss=int(float(ss)),ss=123(截尾取整),不能直接用int(),会报错:ValueError
from matplotlib import pyplot as plt
import json
import requests
from datetime import datetime
fileurl="https://raw.githubusercontent.com/muxuezi/btc/master/btc_close_2017.json"
req=requests.get(fileurl)
with open('btc_close_2017_test.json','w') as f:
f.write(req.text)
with open('btc_close_2017_test.json') as f:
btctest_data=json.load(f)#读取json信息,返回列表
#创建五个列表,分别存储日期和收盘价
dates=[]
months=[]
weeks=[]
weekdays=[]
closes=[]
for btc_dict_test in btctest_data:
date=datetime.strptime(btc_dict_test['date'],'%Y-%m-%d')#处理字符串-->日期
dates.append(date)
#dates.append(btc_dict_test['date'])#若不转换成日期格式,作为横坐标则会每个元素都列出来
month=int(btc_dict_test['month'])
months.append(month)
week=int(btc_dict_test['week'])
weeks.append(week)
weekday=btc_dict_test['weekday']
weekdays.append(weekday)
close=int(float(btc_dict_test['close']))
closes.append(close)
#用matplotlib.pyplot绘制折线图
fig=plt.figure(figsize=(10,6))
plt.plot(dates,closes,linewidth=2,color='g')
plt.title("btc close-2017",fontsize=20)
plt.xlabel("date",fontsize=15)
plt.ylabel("close value",fontsize=15)
plt.tick_params(axis='both',labelsize=15)#横纵坐标的标签字体大小
fig.autofmt_xdate()#绘制倾斜的日期标签,以免重叠(前提是图足够大)
plt.savefig("btc_close_2017_date.png")
plt.show()
#%%
import requests
import pygal
import json
from datetime import datetime
fileurl="https://raw.githubusercontent.com/muxuezi/btc/master/btc_close_2017.json"
req=requests.get(fileurl)
#print(str(type(req.text)))#
#t=json.loads(req.text)#将json格式数据转换为字典(将字符串转化为字典)
#print(str(type(t)))#
btcdata_list=json.loads(req.text)
#创建五个列表,分别存储日期和收盘价
dates=[]
months=[]
weeks=[]
weekdays=[]
closes=[]
for btc_data in btcdata_list:
strtodate=datetime.strptime(btc_data['date'],'%Y-%m-%d')#每个元素都是datetime.datetime(2017,1,1,0,0)
date=strtodate.strftime("%B %d %Y")#'January 01 2017'
dates.append(date)#修改后的日期格式
month=int(btc_data['month'])
months.append(month)
week=int(btc_data['week'])
weeks.append(week)
weekday=btc_data['weekday']
weekdays.append(weekday)
close=int(float(btc_data['close']))
closes.append(close)
#print(dates)#['January 01 2017', 'January 02 2017', 'January 03 2017',
line_chart=pygal.Line()
#line_chart=pygal.Line(x_label_rotation=20,show_minor_x_labels=False)
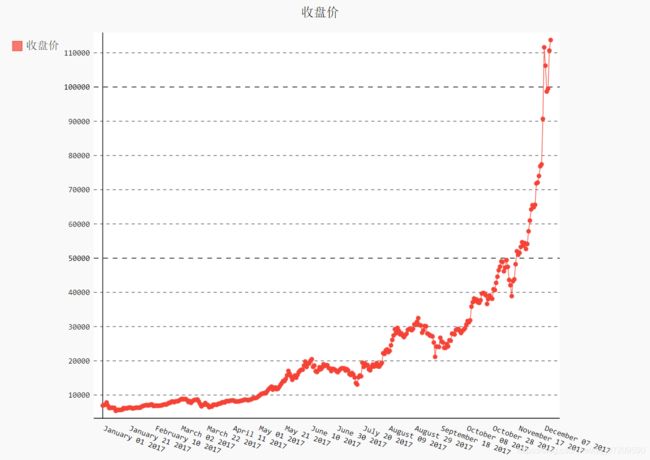
line_chart.title="收盘价"
line_chart.x_labels=dates
N=20
line_chart.x_labels_major=dates[::N]
line_chart.x_label_rotation=20#让x轴上的标签顺时针旋转20度;
line_chart.show_minor_x_labels=False#告诉图形不用显示所有的x轴标签
line_chart.add('收盘价',closes)
#line_chart.render()#得到的结果是前端代码
line_chart.render_to_file("收盘价折线图.svg")
#%%
#对数变换:为了验证周期性的假设,需要首先将非线性的趋势消除
#用以10为底的对数函数math.log10计算收盘价,日期保持不变--半对数变换
import requests
import pygal
import json
from datetime import datetime
import math
fileurl="https://raw.githubusercontent.com/muxuezi/btc/master/btc_close_2017.json"
req=requests.get(fileurl)
#print(str(type(req.text)))#
#t=json.loads(req.text)#将json格式数据转换为字典(将字符串转化为字典)
#print(str(type(t)))#
btcdata_list=json.loads(req.text)
#创建五个列表,分别存储日期和收盘价
dates=[]
months=[]
weeks=[]
weekdays=[]
closes=[]
for btc_data in btcdata_list:
strtodate=datetime.strptime(btc_data['date'],'%Y-%m-%d')#每个元素都是datetime.datetime(2017,1,1,0,0)
date=strtodate.strftime("%B %d %Y")#'January 01 2017'
dates.append(date)#修改后的日期格式
month=int(btc_data['month'])
months.append(month)
week=int(btc_data['week'])
weeks.append(week)
weekday=btc_data['weekday']
weekdays.append(weekday)
close=int(float(btc_data['close']))
closes.append(close)
#print(dates)#['January 01 2017', 'January 02 2017', 'January 03 2017',
line_chart=pygal.Line()
#line_chart=pygal.Line(x_label_rotation=20,show_minor_x_labels=False)
line_chart.title="收盘价对数变换"
line_chart.x_labels=dates
N=20
line_chart.x_labels_major=dates[::N]
line_chart.x_label_rotation=20#让x轴上的标签顺时针旋转20度;
line_chart.show_minor_x_labels=False#告诉图形不用显示所有的x轴标签
close_log=[math.log10(x) for x in closes]
line_chart.add('log收盘价',close_log)
#line_chart.render()#得到的结果是前端代码
line_chart.render_to_file("收盘价对数变换折线图.svg")
#%%
#groupby()把迭代器中 相邻的 重复 元素挑出来 放在一起:
from itertools import groupby
for x,y in groupby('aaabbcaa'):
# print(x,y)
# a
# b
# c
# a
print(x,list(y))
# a ['a', 'a', 'a']
# b ['b', 'b']
# c ['c']
# a ['a', 'a']
for key, group in groupby('AAABBBCCAAA'):
print(key, list(group))
#A ['A', 'A', 'A']
#B ['B', 'B', 'B']
#C ['C', 'C']
#A ['A', 'A', 'A']
for key, group in groupby('AaaBBbcCAAa', lambda c: c.upper()):
print(key, list(group))
#A ['A', 'a', 'a']
#B ['B', 'B', 'b']
#C ['c', 'C']
#A ['A', 'A', 'a']
#%%
#zip() 函数用于将可迭代的对象作为参数,将对象中对应的元素打包成一个个元组,然后返回由这些元组组成的对象,这样做的好处是节约了不少的内存。
#我们可以使用 list() 转换来输出列表。
#如果各个迭代器的元素个数不一致,则返回列表长度与最短的对象相同,利用 * 号操作符,可以将元组解压为列表。
a=[1,2,3]
b=[4,5,6]
c=[4,5,6,7,8]
#print(str(type(zip(a,b))))--
print(list(zip(a,b)))
#[(1, 4), (2, 5), (3, 6)]
print(list(zip(a,c)))
#[(1, 4), (2, 5), (3, 6)]
print(*zip(a,b))
#(1, 4) (2, 5) (3, 6)
x,y=zip(*zip(a,b))#利用 * 号操作符,可以将元组解压为列表
#x,y=zip(*zip(a,c))
print(x)
#(1, 2, 3)
print(y)
#(4, 5, 6)
#%%
import requests
import pygal
import json
from datetime import datetime
from itertools import groupby
#画图函数
def draw_line(x_data,y_data,title,y_legend):
xy_map=[]
for x,y in groupby(sorted(zip(x_data,y_data)),key=lambda _:_[0]):
y_list=[v for _,v in y]
xy_map.append([x,sum(y_list)/len(y_list)])
x_unique,y_mean=[*zip(*xy_map)]
line_chart=pygal.Line()
line_chart.title=title
line_chart.x_labels=x_unique#横坐标 必须为字符串
#line_chart.x_labels=[str(x) for x in x_unique]
line_chart.add(y_legend,y_mean)
line_chart.render_to_file(title+'.svg')
return line_chart
#获取数据
fileurl="https://raw.githubusercontent.com/muxuezi/btc/master/btc_close_2017.json"
req=requests.get(fileurl)
#btcdata_list=req.text
btcdata_list=json.loads(req.text)#将json格式数据转换为字典(将字符串转化为字典)
dates=[]
months=[]
weeks=[]
weekdays=[]
closes=[]
for btc_data in btcdata_list:
# date_temp=datetime.strptime(btc_data['date'],'%Y-%m-%d')
# date=date_temp.strftime("%B %d %Y")
date=btc_data['date']
dates.append(date)
month=int(btc_data['month'])
months.append(month)
week=int(btc_data['week'])
weeks.append(week)
weekday=btc_data['weekday']
weekdays.append(weekday)
close=int(float(btc_data['close']))
closes.append(close)
#调用函数def draw_line(x_data,y_data,title,y_legend):
idx_month=dates.index('2017-12-01')
line=draw_line(months[:idx_month],closes[:idx_month],'收盘价月日均值','月日均值')
#%%
#遍历元素类型为元组的列表
it=[(100,2),(20,40)]
for w,q in it:
print(w,q)
#100 2
#20 40
#%%
#收盘价数据仪表盘
with open('收盘价dashboard.html','w',encoding='utf8') as html_file:
html_file.write('收盘价dashboard \n')
for svg in ['收盘价对数变换折线图.svg','收盘价月日均值.svg','收盘价折线图.svg']:
html_file.write(' \n'.format(svg))
html_file.write('')