arthas使用
官方文档
Github: https://github.com/alibaba/arthas
文档: https://arthas.aliyun.com/doc/
Arthas 是一款线上监控诊断产品,通过全局视角实时查看应用 load、内存、gc、线程的状态信息,并能在不修改应用代码的情况下,对业务问题进行诊断,包括查看方法调用的出入参、异常,监测方法执行耗时,类加载信息等,大大提升线上问题排查效率。
安装启动
快速下载
curl -O https://arthas.aliyun.com/arthas-boot.jar
java -jar arthas-boot.jar
下载完成后启动
$ $ java -jar arthas-boot.jar
* [1]: 35542
  [2]: 71560 math-game.jar
math-game进程是第 2 个,则输入 2,再输入回车/enter。Arthas 会 attach 到目标进程上,并输出日志:
[INFO] arthas home: C:\Users\xiao.ming\.arthas\lib\3.6.9\arthas
[INFO] Try to attach process 13996
[INFO] Attach process 13996 success.
[INFO] arthas-client connect 127.0.0.1 3658
  ,---.  ,------. ,--------.,--.  ,--.  ,---.   ,---.
 /  O  \ |  .--. ''--.  .--'|  '--'  | /  O  \ '   .-'
|  .-.  ||  '--'.'   |  |   |  .--.  ||  .-.  |`.  `-.
|  | |  ||  |\  \    |  |   |  |  |  ||  | |  |.-'    |
`--' `--'`--' '--'   `--'   `--'  `--'`--' `--'`-----'

wiki       https://arthas.aliyun.com/doc
tutorials  https://arthas.aliyun.com/doc/arthas-tutorials.html
version    3.6.9
main_class
pid        13996
time       2023-07-17 16:51:16
查看 dashboard
输入dashboard,按回车/enter,会展示当前进程的信息,按ctrl+c可以中断执行。
退出arthas
quit 退出当前 Arthas 客户端,其他 Arthas 客户端不受影响
exit 等同于quit
stop 关闭 Arthas 服务端,所有 Arthas 客户端全部退出
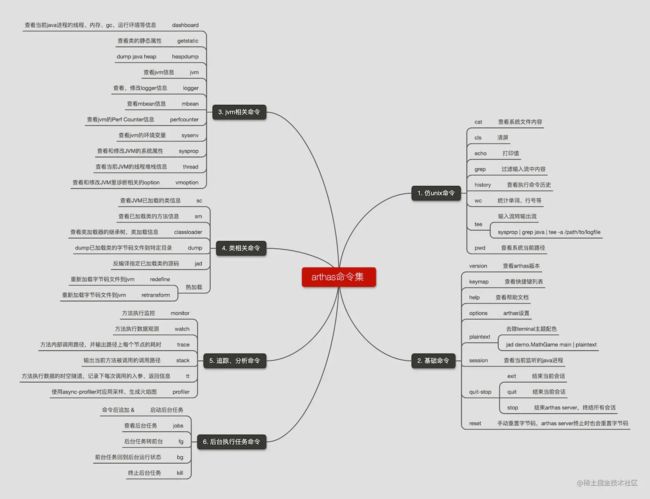
常用命令
dashboard
功能 展示当前java进程的实时数据(线程、gc、jvm内存占用等)信息。
# 展示当前java进程 线程cpu占用、gc信息、jvm信息等,5s刷新一次
dashboard

# 刷新10次后终止,默认5s刷新一次
dashboard -n 10

# 2s刷新一次
dashboard -i 2000

# 2s刷新一次,共刷新10次
dashboard -i 2000 -n 10

# 2s刷新一次,共刷新10次,并保存到文件中,用于后续分析
dashboard -i 2000 -n 10 | tee /data/dashback_2021_02_21.txt
thread
功能 展示当前java进程详细的线程信息
# 展示所有的线程列表
thread
thread-all

# cpu使用率采样修改为2s,默认为200ms
thread -i 2000

# 打印出cpu使用率前5的线程详情,即比较繁忙的线程,cpu使用率采样统计方式请参考官方文档说明
thread -n 5

# 打印id为5的线程详情
thread 5

# 根据状态过滤线程数据(NEW, RUNNABLE, TIMED_WAITING, WAITING, BLOCKED, TERMINATED)
thread --state RUNNABLE
thread |grep RUNNABLE

# 列出持有某个锁,阻塞其他线程最多的线程,排查死锁
thread -b
watch
功能 观测某方法执行的详情
# 观测某方法的执行详情,支持ognl表达式输出观测结果
watch *VipUserController helloUser '{clazz,method,isReturn,isThrow,params,target,returnObj,throwExp}'
:<<!
常用表达式
target : the object
clazz : the object's class
method : the constructor or method
params : the parameters array of method
params[0..n] : the element of parameters array
returnObj : the returned object of method
throwExp : the throw exception of method
isReturn : the method ended by return
isThrow : the method ended by throwing exception
#cost : the execution time in ms of method invocation
!

# 限制观测执行次数
watch *VipUserController helloUser -n 2

# 设置观测结果遍历深度
wathch *VipUserController helloUser -x 2

# 只观测执行成功
watch *VipUserController helloUser -s

# 只观测执行失败
watch *VipUserController helloUser -e

# 同时观测方法执行前、方法执行后结果
watch *VipUserController helloUser -b -f

# 观测方法执行异常时,详细的异常栈信息
watch *VipUserController helloUser '{throwExp}' -e -x 2

# 观测方法执行时间大于200ms的信息
watch *VipUserController helloUser '#cost>100'
trace
功能 追踪方法内部调用路径,并输出方法路径上的每个节点上耗时(只会打印到第一层)
# 观测方法内部调用顺序及耗时
trace top.learningwang.arthasdemo.controller.VipUserController helloUser

# 观测方法内部调用顺序及耗时,只观测3次
trace top.learningwang.arthasdemo.controller.VipUserController helloUser -n 3

# 观测方法内部调用顺序及耗时,包含jdk内部方法
trace top.learningwang.arthasdemo.controller.VipUserController helloUser --skipJDKMethod false

# 限制观测范围,第一个参数长度大于10
trace top.learningwang.arthasdemo.controller.VipUserController helloUser params[0].length>=10

# 限制观测范围,执行耗时大于100ms
trace top.learningwang.arthasdemo.controller.VipUserController helloUser '#cost>100'

# trace 同时多个类的多个方法
trace -E com.test.ClassA|org.test.ClassB method1|method2|method3
monitor
方法执行监控
对匹配 class-pattern/method-pattern/condition-express的类、方法的调用进行监控。
monitor 命令是一个非实时返回命令.
实时返回命令是输入之后立即返回,而非实时返回的命令,则是不断的等待目标 Java 进程返回信息,直到用户输入 Ctrl+C 为止。
服务端是以任务的形式在后台跑任务,植入的代码随着任务的中止而不会被执行,所以任务关闭后,不会对原有性能产生太大影响,而且原则上,任何 Arthas 命令不会引起原有业务逻辑的改变。