SHAP(六):使用 XGBoost 和 HyperOpt 进行信用卡欺诈检测
SHAP(六):使用 XGBoost 和 HyperOpt 进行信用卡欺诈检测
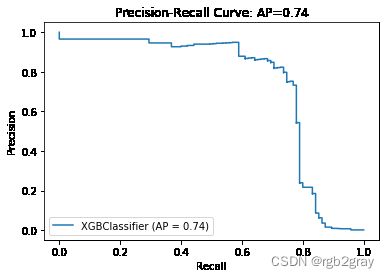
本笔记本介绍了 XGBoost Classifier 在金融行业中的实现,特别是在信用卡欺诈检测方面。 构建 XGBoost 分类器后,它将使用 HyperOpt 库(sklearn 的 GridSearchCV 和 RandomziedSearchCV 算法的替代方案)来调整各种模型参数,目标是实现正常交易和欺诈交易分类的最大 f1 分数。 作为模型评估的一部分,将计算 f1 分数度量,为分类构建混淆矩阵,生成分类报告并绘制精确召回曲线。 最后,将根据 XGBoost 的内部算法以及特征重要性的 SHAP 实现来计算和绘制特征重要性。
来源:https://github.com/albazahm/Credit_Card_Fraud_Detection_with_XGBoost_and_HyperOpt/tree/master
1. Loading Libraries and Data
#loading libraries
import numpy as np
import pandas as pd
import matplotlib.pyplot as plt
from sklearn.metrics import f1_score, make_scorer, confusion_matrix, classification_report, precision_recall_curve, plot_precision_recall_curve, average_precision_score, auc
from sklearn.model_selection import train_test_split
import seaborn as sns
from hyperopt import hp, fmin, tpe, Trials, STATUS_OK
import xgboost as xgb
import shap
# Any results you write to the current directory are saved as output.
/kaggle/input/creditcardfraud/creditcard.csv
#loading the data into a dataframe
credit_df = pd.read_csv('./creditcard.csv')
2. Data Overview
#preview of the first 10 rows of data
credit_df.head(10)
| Time | V1 | V2 | V3 | V4 | V5 | V6 | V7 | V8 | V9 | ... | V21 | V22 | V23 | V24 | V25 | V26 | V27 | V28 | Amount | Class | |
|---|---|---|---|---|---|---|---|---|---|---|---|---|---|---|---|---|---|---|---|---|---|
| 0 | 0.0 | -1.359807 | -0.072781 | 2.536347 | 1.378155 | -0.338321 | 0.462388 | 0.239599 | 0.098698 | 0.363787 | ... | -0.018307 | 0.277838 | -0.110474 | 0.066928 | 0.128539 | -0.189115 | 0.133558 | -0.021053 | 149.62 | 0 |
| 1 | 0.0 | 1.191857 | 0.266151 | 0.166480 | 0.448154 | 0.060018 | -0.082361 | -0.078803 | 0.085102 | -0.255425 | ... | -0.225775 | -0.638672 | 0.101288 | -0.339846 | 0.167170 | 0.125895 | -0.008983 | 0.014724 | 2.69 | 0 |
| 2 | 1.0 | -1.358354 | -1.340163 | 1.773209 | 0.379780 | -0.503198 | 1.800499 | 0.791461 | 0.247676 | -1.514654 | ... | 0.247998 | 0.771679 | 0.909412 | -0.689281 | -0.327642 | -0.139097 | -0.055353 | -0.059752 | 378.66 | 0 |
| 3 | 1.0 | -0.966272 | -0.185226 | 1.792993 | -0.863291 | -0.010309 | 1.247203 | 0.237609 | 0.377436 | -1.387024 | ... | -0.108300 | 0.005274 | -0.190321 | -1.175575 | 0.647376 | -0.221929 | 0.062723 | 0.061458 | 123.50 | 0 |
| 4 | 2.0 | -1.158233 | 0.877737 | 1.548718 | 0.403034 | -0.407193 | 0.095921 | 0.592941 | -0.270533 | 0.817739 | ... | -0.009431 | 0.798278 | -0.137458 | 0.141267 | -0.206010 | 0.502292 | 0.219422 | 0.215153 | 69.99 | 0 |
| 5 | 2.0 | -0.425966 | 0.960523 | 1.141109 | -0.168252 | 0.420987 | -0.029728 | 0.476201 | 0.260314 | -0.568671 | ... | -0.208254 | -0.559825 | -0.026398 | -0.371427 | -0.232794 | 0.105915 | 0.253844 | 0.081080 | 3.67 | 0 |
| 6 | 4.0 | 1.229658 | 0.141004 | 0.045371 | 1.202613 | 0.191881 | 0.272708 | -0.005159 | 0.081213 | 0.464960 | ... | -0.167716 | -0.270710 | -0.154104 | -0.780055 | 0.750137 | -0.257237 | 0.034507 | 0.005168 | 4.99 | 0 |
| 7 | 7.0 | -0.644269 | 1.417964 | 1.074380 | -0.492199 | 0.948934 | 0.428118 | 1.120631 | -3.807864 | 0.615375 | ... | 1.943465 | -1.015455 | 0.057504 | -0.649709 | -0.415267 | -0.051634 | -1.206921 | -1.085339 | 40.80 | 0 |
| 8 | 7.0 | -0.894286 | 0.286157 | -0.113192 | -0.271526 | 2.669599 | 3.721818 | 0.370145 | 0.851084 | -0.392048 | ... | -0.073425 | -0.268092 | -0.204233 | 1.011592 | 0.373205 | -0.384157 | 0.011747 | 0.142404 | 93.20 | 0 |
| 9 | 9.0 | -0.338262 | 1.119593 | 1.044367 | -0.222187 | 0.499361 | -0.246761 | 0.651583 | 0.069539 | -0.736727 | ... | -0.246914 | -0.633753 | -0.120794 | -0.385050 | -0.069733 | 0.094199 | 0.246219 | 0.083076 | 3.68 | 0 |
10 rows × 31 columns
#displaying descriptive statistics
credit_df.describe()
| Time | V1 | V2 | V3 | V4 | V5 | V6 | V7 | V8 | V9 | ... | V21 | V22 | V23 | V24 | V25 | V26 | V27 | V28 | Amount | Class | |
|---|---|---|---|---|---|---|---|---|---|---|---|---|---|---|---|---|---|---|---|---|---|
| count | 284807.000000 | 2.848070e+05 | 2.848070e+05 | 2.848070e+05 | 2.848070e+05 | 2.848070e+05 | 2.848070e+05 | 2.848070e+05 | 2.848070e+05 | 2.848070e+05 | ... | 2.848070e+05 | 2.848070e+05 | 2.848070e+05 | 2.848070e+05 | 2.848070e+05 | 2.848070e+05 | 2.848070e+05 | 2.848070e+05 | 284807.000000 | 284807.000000 |
| mean | 94813.859575 | 3.919560e-15 | 5.688174e-16 | -8.769071e-15 | 2.782312e-15 | -1.552563e-15 | 2.010663e-15 | -1.694249e-15 | -1.927028e-16 | -3.137024e-15 | ... | 1.537294e-16 | 7.959909e-16 | 5.367590e-16 | 4.458112e-15 | 1.453003e-15 | 1.699104e-15 | -3.660161e-16 | -1.206049e-16 | 88.349619 | 0.001727 |
| std | 47488.145955 | 1.958696e+00 | 1.651309e+00 | 1.516255e+00 | 1.415869e+00 | 1.380247e+00 | 1.332271e+00 | 1.237094e+00 | 1.194353e+00 | 1.098632e+00 | ... | 7.345240e-01 | 7.257016e-01 | 6.244603e-01 | 6.056471e-01 | 5.212781e-01 | 4.822270e-01 | 4.036325e-01 | 3.300833e-01 | 250.120109 | 0.041527 |
| min | 0.000000 | -5.640751e+01 | -7.271573e+01 | -4.832559e+01 | -5.683171e+00 | -1.137433e+02 | -2.616051e+01 | -4.355724e+01 | -7.321672e+01 | -1.343407e+01 | ... | -3.483038e+01 | -1.093314e+01 | -4.480774e+01 | -2.836627e+00 | -1.029540e+01 | -2.604551e+00 | -2.256568e+01 | -1.543008e+01 | 0.000000 | 0.000000 |
| 25% | 54201.500000 | -9.203734e-01 | -5.985499e-01 | -8.903648e-01 | -8.486401e-01 | -6.915971e-01 | -7.682956e-01 | -5.540759e-01 | -2.086297e-01 | -6.430976e-01 | ... | -2.283949e-01 | -5.423504e-01 | -1.618463e-01 | -3.545861e-01 | -3.171451e-01 | -3.269839e-01 | -7.083953e-02 | -5.295979e-02 | 5.600000 | 0.000000 |
| 50% | 84692.000000 | 1.810880e-02 | 6.548556e-02 | 1.798463e-01 | -1.984653e-02 | -5.433583e-02 | -2.741871e-01 | 4.010308e-02 | 2.235804e-02 | -5.142873e-02 | ... | -2.945017e-02 | 6.781943e-03 | -1.119293e-02 | 4.097606e-02 | 1.659350e-02 | -5.213911e-02 | 1.342146e-03 | 1.124383e-02 | 22.000000 | 0.000000 |
| 75% | 139320.500000 | 1.315642e+00 | 8.037239e-01 | 1.027196e+00 | 7.433413e-01 | 6.119264e-01 | 3.985649e-01 | 5.704361e-01 | 3.273459e-01 | 5.971390e-01 | ... | 1.863772e-01 | 5.285536e-01 | 1.476421e-01 | 4.395266e-01 | 3.507156e-01 | 2.409522e-01 | 9.104512e-02 | 7.827995e-02 | 77.165000 | 0.000000 |
| max | 172792.000000 | 2.454930e+00 | 2.205773e+01 | 9.382558e+00 | 1.687534e+01 | 3.480167e+01 | 7.330163e+01 | 1.205895e+02 | 2.000721e+01 | 1.559499e+01 | ... | 2.720284e+01 | 1.050309e+01 | 2.252841e+01 | 4.584549e+00 | 7.519589e+00 | 3.517346e+00 | 3.161220e+01 | 3.384781e+01 | 25691.160000 | 1.000000 |
8 rows × 31 columns
#exploring datatypes and count of non-NULL rows for each feature
credit_df.info()
RangeIndex: 284807 entries, 0 to 284806
Data columns (total 31 columns):
Time      284807 non-null float64
V1        284807 non-null float64
V2        284807 non-null float64
V3        284807 non-null float64
V4        284807 non-null float64
V5        284807 non-null float64
V6        284807 non-null float64
V7        284807 non-null float64
V8        284807 non-null float64
V9        284807 non-null float64
V10       284807 non-null float64
V11       284807 non-null float64
V12       284807 non-null float64
V13       284807 non-null float64
V14       284807 non-null float64
V15       284807 non-null float64
V16       284807 non-null float64
V17       284807 non-null float64
V18       284807 non-null float64
V19       284807 non-null float64
V20       284807 non-null float64
V21       284807 non-null float64
V22       284807 non-null float64
V23       284807 non-null float64
V24       284807 non-null float64
V25       284807 non-null float64
V26       284807 non-null float64
V27       284807 non-null float64
V28       284807 non-null float64
Amount    284807 non-null float64
Class     284807 non-null int64
dtypes: float64(30), int64(1)
memory usage: 67.4 MB
3. Data Preparation
在这里,我们查找并删除数据中的重复观测值,定义用于分类的自变量 (X) 和因变量 (Y),并分离出验证集和测试集。
#checking for duplicated observations
credit_df.duplicated().value_counts()
False    283726
True       1081
dtype: int64
#dropping duplicated observations
credit_df = credit_df.drop_duplicates()
#defining independent (X) and dependent (Y) variables from dataframe
X = credit_df.drop(columns = 'Class')
Y = credit_df['Class'].values
#splitting a testing set from the data
X_train, X_test, Y_train, Y_test = train_test_split(X, Y, test_size = 0.20, stratify = Y, random_state = 42)
#splitting a validation set from the training set to tune parameters
X_train, X_val, Y_train, Y_val = train_test_split(X_train, Y_train, test_size = 0.20, stratify = Y_train, random_state = 42)
4. Model Set-Up and Training
在本节中,我们基于 f1 度量创建一个评分器,并为 XGBoost 模型定义参数搜索空间。 此外,我们定义了一个包含分类器的函数,提取其预测,计算损失并将其提供给优化器。 最后,我们使用所需的设置初始化优化器,运行它并查看试验中的参数和分数。
#creating a scorer from the f1-score metric
f1_scorer = make_scorer(f1_score)
# defining the space for hyperparameter tuning
space = {'eta': hp.uniform("eta", 0.1, 1),
        'max_depth': hp.quniform("max_depth", 3, 18, 1),
        'gamma': hp.uniform ('gamma', 1,9),
        'reg_alpha' : hp.quniform('reg_alpha', 50, 200, 1),
        'reg_lambda' : hp.uniform('reg_lambda', 0, 1),
        'colsample_bytree' : hp.uniform('colsample_bytree', 0.5, 1),
        'min_child_weight' : hp.quniform('min_child_weight', 0, 10, 1),
        'n_estimators': hp.quniform('n_estimators', 100, 200, 10)
        }
#defining function to optimize
def hyperparameter_tuning(space):
    clf = xgb.XGBClassifier(n_estimators = int(space['n_estimators']),       #number of trees to use
                            eta = space['eta'],                              #learning rate
                            max_depth = int(space['max_depth']),             #depth of trees
                            gamma = space['gamma'],                          #loss reduction required to further partition tree
                            reg_alpha = int(space['reg_alpha']),             #L1 regularization for weights
                            reg_lambda = space['reg_lambda'],                #L2 regularization for weights
                            min_child_weight = space['min_child_weight'],    #minimum sum of instance weight needed in child
                            colsample_bytree = space['colsample_bytree'],    #ratio of column sampling for each tree
                            nthread = -1)                                    #number of parallel threads used

    evaluation = [(X_train, Y_train), (X_val, Y_val)]

    clf.fit(X_train, Y_train,
            eval_set = evaluation,
            early_stopping_rounds = 10,
            verbose = False)

    pred = clf.predict(X_val)
    pred = [1 if i>= 0.5 else 0 for i in pred]
    f1 = f1_score(Y_val, pred)
    print ("SCORE:", f1)
    return {'loss': -f1, 'status': STATUS_OK }
# run the hyper paramter tuning
trials = Trials()
best = fmin(fn = hyperparameter_tuning,
            space = space,
            algo = tpe.suggest,
            max_evals = 100,
            trials = trials)

print (best)
SCORE:
0.7552447552447553
SCORE:
0.0
SCORE:
0.0
SCORE:
0.0
SCORE:
0.0
SCORE:
0.0
SCORE:
0.0
SCORE:
0.0
SCORE:
0.0
SCORE:
0.0
SCORE:
0.8169014084507042
SCORE:
0.0
SCORE:
0.0
SCORE:
0.0
SCORE:
0.6666666666666666
SCORE:
0.7737226277372262
SCORE:
0.0
SCORE:
0.0
SCORE:
0.0
SCORE:
0.0
SCORE:
0.8169014084507042
SCORE:
0.8169014084507042
SCORE:
0.8169014084507042
SCORE:
0.7891156462585034
SCORE:
0.7401574803149605
SCORE:
0.7737226277372262
SCORE:
0.7971014492753624
SCORE:
0.7499999999999999
SCORE:
0.0
SCORE:
0.7552447552447553
SCORE:
0.0
SCORE:
0.7883211678832117
SCORE:
0.7891156462585034
SCORE:
0.7737226277372262
SCORE:
0.782608695652174
SCORE:
0.8055555555555555
SCORE:
0.7401574803149605
SCORE:
0.0
SCORE:
0.0
SCORE:
0.7552447552447553
SCORE:
0.0
SCORE:
0.0
SCORE:
0.0
SCORE:
0.0
SCORE:
0.0
SCORE:
0.0
SCORE:
0.7737226277372262
SCORE:
0.7499999999999999
SCORE:
0.0
SCORE:
0.8085106382978723
SCORE:
0.0
SCORE:
0.0
SCORE:
0.0
SCORE:
0.7401574803149605
SCORE:
0.0
SCORE:
0.7972972972972973
SCORE:
0.608695652173913
SCORE:
0.7552447552447553
SCORE:
0.0
SCORE:
0.0
SCORE:
0.7384615384615385
SCORE:
0.8169014084507042
SCORE:
0.802919708029197
SCORE:
0.8169014084507042
SCORE:
0.8201438848920864
SCORE:
0.8201438848920864
SCORE:
0.8201438848920864
SCORE:
0.8085106382978723
SCORE:
0.8169014084507042
SCORE:
0.8085106382978723
SCORE:
0.7910447761194029
SCORE:
0.0
SCORE:
0.7819548872180451
SCORE:
0.802919708029197
SCORE:
0.8085106382978723
SCORE:
0.8169014084507042
SCORE:
0.7910447761194029
SCORE:
0.7910447761194029
SCORE:
0.0
SCORE:
0.0
SCORE:
0.0
SCORE:
0.7999999999999999
SCORE:
0.8085106382978723
SCORE:
0.8169014084507042
SCORE:
0.7692307692307692
SCORE:
0.7999999999999999
SCORE:
0.0
SCORE:
0.7737226277372262
SCORE:
0.0
SCORE:
0.0
SCORE:
0.7301587301587301
SCORE:
0.7786259541984732
SCORE:
0.7878787878787878
SCORE:
0.0
SCORE:
0.7878787878787878
SCORE:
0.7692307692307692
SCORE:
0.0
SCORE:
0.7499999999999999
SCORE:
0.8169014084507042
SCORE:
0.7910447761194029
100%|██████████| 100/100 [11:24<00:00,  6.84s/trial, best loss: -0.8201438848920864]
{'colsample_bytree': 0.9999995803500363, 'eta': 0.1316102455832729, 'gamma': 1.6313395777817137, 'max_depth': 5.0, 'min_child_weight': 3.0, 'n_estimators': 100.0, 'reg_alpha': 47.0, 'reg_lambda': 0.4901343161108276}
#plotting feature space and f1-scores for the different trials
parameters = space.keys()
cols = len(parameters)

f, axes = plt.subplots(nrows=1, ncols=cols, figsize=(20,5))
cmap = plt.cm.jet
for i, val in enumerate(parameters):
    xs = np.array([t['misc']['vals'][val] for t in trials.trials]).ravel()
    ys = [-t['result']['loss'] for t in trials.trials]
    xs, ys = zip(*sorted(zip(xs, ys)))
    axes[i].scatter(xs, ys, s=20, linewidth=0.01, alpha=0.25, c=cmap(float(i)/len(parameters)))
    axes[i].set_title(val)
    axes[i].grid()
#printing best model parameters
print(best)
{'colsample_bytree': 0.9999995803500363, 'eta': 0.1316102455832729, 'gamma': 1.6313395777817137, 'max_depth': 5.0, 'min_child_weight': 3.0, 'n_estimators': 100.0, 'reg_alpha': 47.0, 'reg_lambda': 0.4901343161108276}
5. Model Test and Evaluation
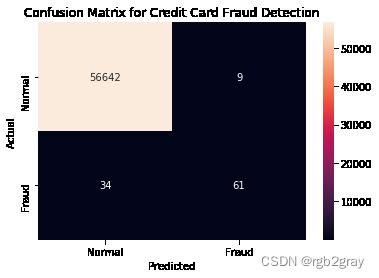
本节将探讨并可视化模型在测试数据上的表现。
#initializing XGBoost Classifier with best model parameters
best_clf = xgb.XGBClassifier(n_estimators = int(best['n_estimators']),
                            eta = best['eta'],
                            max_depth = int(best['max_depth']),
                            gamma = best['gamma'],
                            reg_alpha = int(best['reg_alpha']),
                            min_child_weight = best['min_child_weight'],
                            colsample_bytree = best['colsample_bytree'],
                            nthread = -1)
#fitting XGBoost Classifier with best model parameters to training data
best_clf.fit(X_train, Y_train)
XGBClassifier(base_score=0.5, booster='gbtree', colsample_bylevel=1,
              colsample_bynode=1, colsample_bytree=0.9999995803500363,
              eta=0.1316102455832729, gamma=1.6313395777817137,
              learning_rate=0.1, max_delta_step=0, max_depth=5,
              min_child_weight=3.0, missing=None, n_estimators=100, n_jobs=1,
              nthread=-1, objective='binary:logistic', random_state=0,
              reg_alpha=47, reg_lambda=1, scale_pos_weight=1, seed=None,
              silent=None, subsample=1, verbosity=1)
#using the model to predict on the test set
Y_pred = best_clf.predict(X_test)
#printing f1 score of test set predictions
print('The f1-score on the test data is: {0:.2f}'.format(f1_score(Y_test, Y_pred)))
The f1-score on the test data is: 0.74
#creating a confusion matrix and labels
cm = confusion_matrix(Y_test, Y_pred)
labels = ['Normal', 'Fraud']
#plotting the confusion matrix
sns.heatmap(cm, annot = True, xticklabels = labels, yticklabels = labels, fmt = 'd')
plt.xlabel('Predicted')
plt.ylabel('Actual')
plt.title('Confusion Matrix for Credit Card Fraud Detection')
Text(0.5, 1.0, 'Confusion Matrix for Credit Card Fraud Detection')
#printing classification report
print(classification_report(Y_test, Y_pred))
              precision    recall  f1-score   support

           0       1.00      1.00      1.00     56651
           1       0.87      0.64      0.74        95

    accuracy                           1.00     56746
   macro avg       0.94      0.82      0.87     56746
weighted avg       1.00      1.00      1.00     56746
Y_score = best_clf.predict_proba(X_test)[:, 1]
average_precision = average_precision_score(Y_test, Y_score)
fig = plot_precision_recall_curve(best_clf, X_test, Y_test)
fig.ax_.set_title('Precision-Recall Curve: AP={0:.2f}'.format(average_precision))
Text(0.5, 1.0, 'Precision-Recall Curve: AP=0.74')
6. Feature Importances
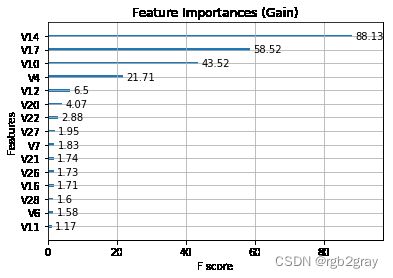
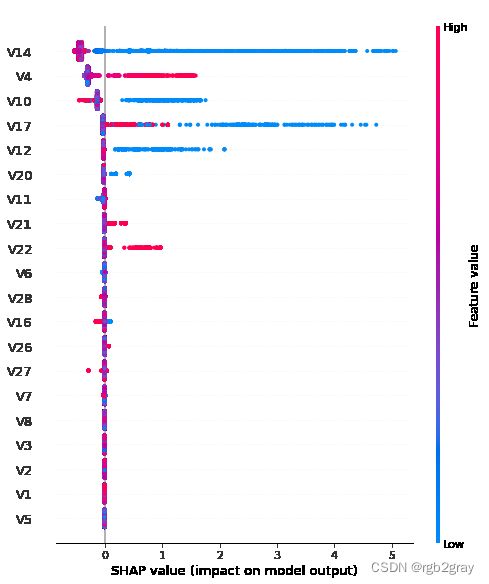
本节将介绍两种算法,一种在 XGBoost 中,一种在 SHAP 中,用于可视化特征重要性。 不幸的是,由于该数据集的特征是使用主成分分析(PCA)进行编码的,因此我们无法凭直觉得出模型如何从实际角度预测正常交易和欺诈交易的结论。
#extracting the booster from model
booster = best_clf.get_booster()

# scoring features based on information gain
importance = booster.get_score(importance_type = "gain")

#rounding importances to 2 decimal places
for key in importance.keys():
    importance[key] = round(importance[key],2)

# plotting feature importances
ax = xgb.plot_importance(importance, importance_type='gain', show_values=True)
plt.title('Feature Importances (Gain)')
plt.show()
#obtaining SHAP values for XGBoost Model
explainer = shap.TreeExplainer(best_clf)
shap_values = explainer.shap_values(X_train)
#plotting SHAP Values of Feature Importances
shap.summary_plot(shap_values, X_train)


