uniapp基于uView的UI组件u-grid-item九宫格实现uCharts秋云可视化图表展示
这里使用uView的u-grid-item九宫格组件去显示图标排列
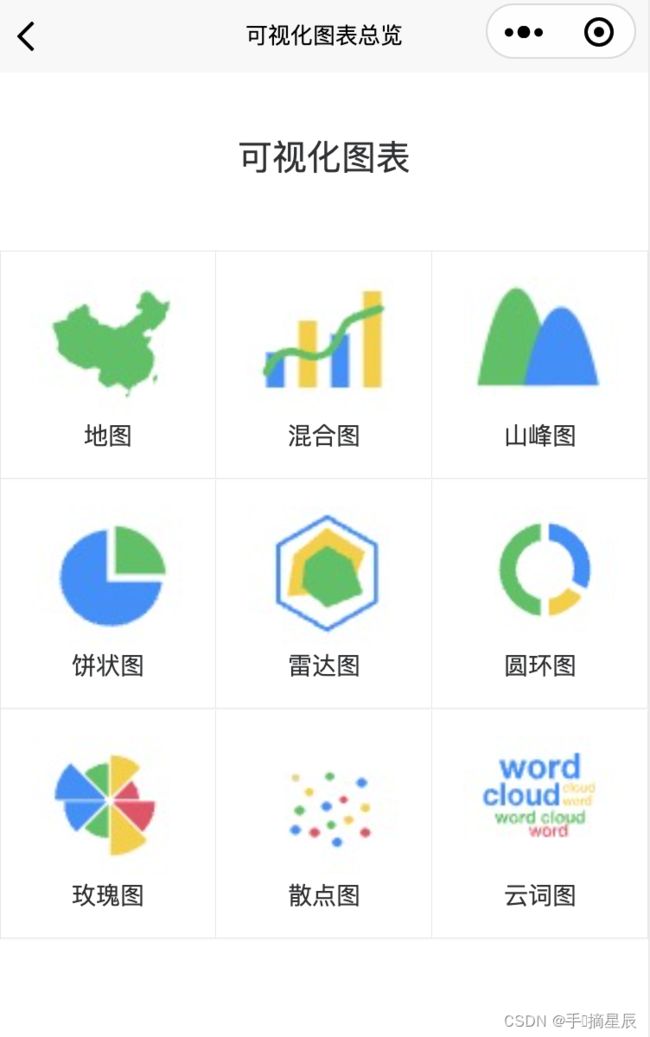
九宫格可以做成多列,移动设备上可以通过左右滑动进行展示
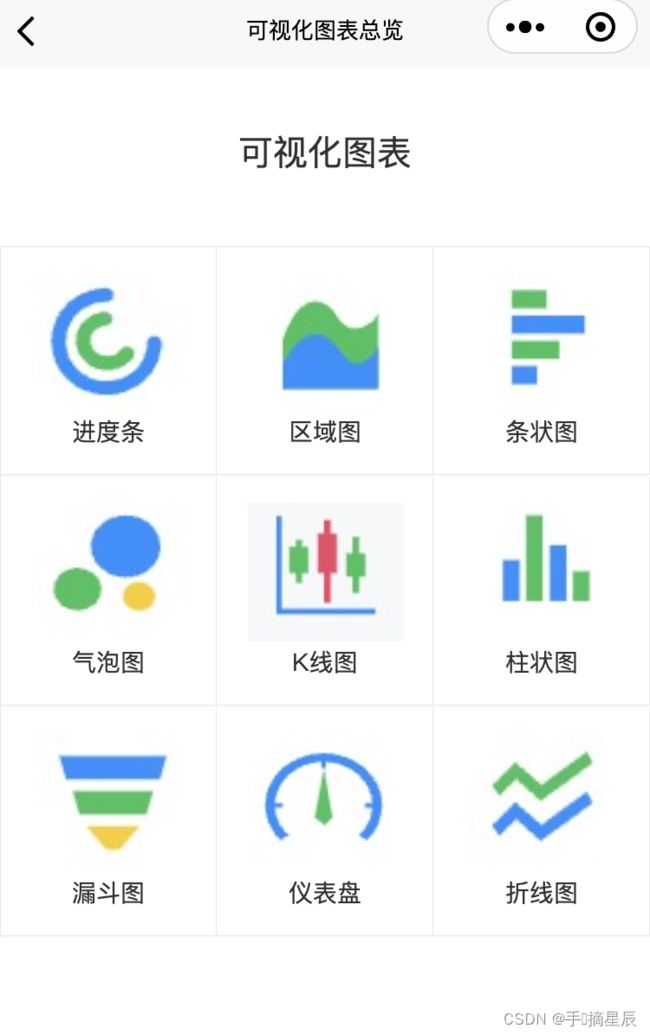
<template>
<div>
<div style="text-align: center;font-size: 20px;padding: 40px 0px;">可视化图表</div>
<swiper class="swiper">
<swiper-item>
<u-grid :col="3" @click="toEchartsInfo()" hover-class="hover-class">
<u-grid-item v-for="(item, index) in listIcon" :index="index" :key="index">
<img :src="item.img" class="iconImg"></img>
<text class="grid-text">{{item.name}}</text>
</u-grid-item>
</u-grid>
</swiper-item>
<swiper-item>
<u-grid :col="3" @click="toEchartsItem()">
<u-grid-item v-for="(item, index) in listList" :index="index" :key="index">
<img :src="item.img" class="iconImg"></img>
<text class="grid-text">{{item.name}}</text>
</u-grid-item>
</u-grid>
</swiper-item>
</swiper>
</div>
</template>
<script>
export default {
data() {
return {
current: 0,
listIcon: [
{name:'进度条',img:'../../static/echartsicon/arcbar.jpeg'},
{name:'区域图',img:'../../static/echartsicon/area.jpeg'},
{name:'条状图',img:'../../static/echartsicon/bar.jpeg'},
{name:'气泡图',img:'../../static/echartsicon/bubble.jpeg'},
{name:'K线图',img:'../../static/echartsicon/candle.jpeg'},
{name:'柱状图',img:'../../static/echartsicon/column.jpeg'},
{name:'漏斗图',img:'../../static/echartsicon/funnel.jpeg'},
{name:'仪表盘',img:'../../static/echartsicon/gauge.jpeg'},
{name:'折线图',img:'../../static/echartsicon/line.jpeg'},
],
listList: [
{name:'地图',img:'../../static/echartsicon/map.jpeg'},
{name:'混合图',img:'../../static/echartsicon/mix.jpeg'},
{name:'山峰图',img:'../../static/echartsicon/mount.jpeg'},
{name:'饼状图',img:'../../static/echartsicon/pie.jpeg'},
{name:'雷达图',img:'../../static/echartsicon/radar.jpeg'},
{name:'圆环图',img:'../../static/echartsicon/ring.jpeg'},
{name:'玫瑰图',img:'../../static/echartsicon/rose.jpeg'},
{name:'散点图',img:'../../static/echartsicon/scatter.jpeg'},
{name:'云词图',img:'../../static/echartsicon/word.jpeg'},
],
};
},
methods: {
toEchartsInfo(index){
if(index==0){
this.$u.route('/pages/echartsShow/echartsArcbar')
}else if(index==1){
this.$u.route('/pages/echartsShow/echartsArea')
}else if(index==2){
this.$u.route('/pages/echartsShow/echartsBar')
}else if(index==3){
this.$u.route('/pages/echartsShow/echartsBubble')
}else if(index==4){
this.$u.route('/pages/echartsShow/echartsCandle')
}else if(index==5){
this.$u.route('/pages/echartsShow/echartsColumn')
}else if(index==6){
this.$u.route('/pages/echartsShow/echartsFunnel')
}else if(index==7){
this.$u.route('/pages/echartsShow/echartsGauge')
}else if(index==8){
this.$u.route('/pages/echartsShow/echartsLine')
}
},
toEchartsItem(index){
if(index==0){
this.$u.route('/pages/echartsShow/echartsMap')
}else if(index==1){
this.$u.route('/pages/echartsShow/echartsMix')
}else if(index==2){
this.$u.route('/pages/echartsShow/echartsMount')
}else if(index==3){
this.$u.route('/pages/echartsShow/echartsPie')
}else if(index==4){
this.$u.route('/pages/echartsShow/echartsRadar')
}else if(index==5){
this.$u.route('/pages/echartsShow/echartsRing')
}else if(index==6){
this.$u.route('/pages/echartsShow/echartsRose')
}else if(index==7){
this.$u.route('/pages/echartsShow/echartsScatter')
}else if(index==8){
this.$u.route('/pages/echartsShow/echartsWord')
}
}
}
};
</script>
<style>
.grid-text {
font-size: 28rpx;
margin-top: 4rpx;
color: $u-type-info;
}
.swiper {
height: 100vh;
}
.indicator-dots {
margin-top: 40rpx;
display: flex;
justify-content: center;
align-items: center;
}
.indicator-dots-item {
background-color: $u-tips-color;
height: 6px;
width: 6px;
border-radius: 10px;
margin: 0 3px;
}
.indicator-dots-active {
background-color: $u-type-primary;
}
.iconImg{
width: 90px;
height: 80px;
}
</style>
进度条详情展示
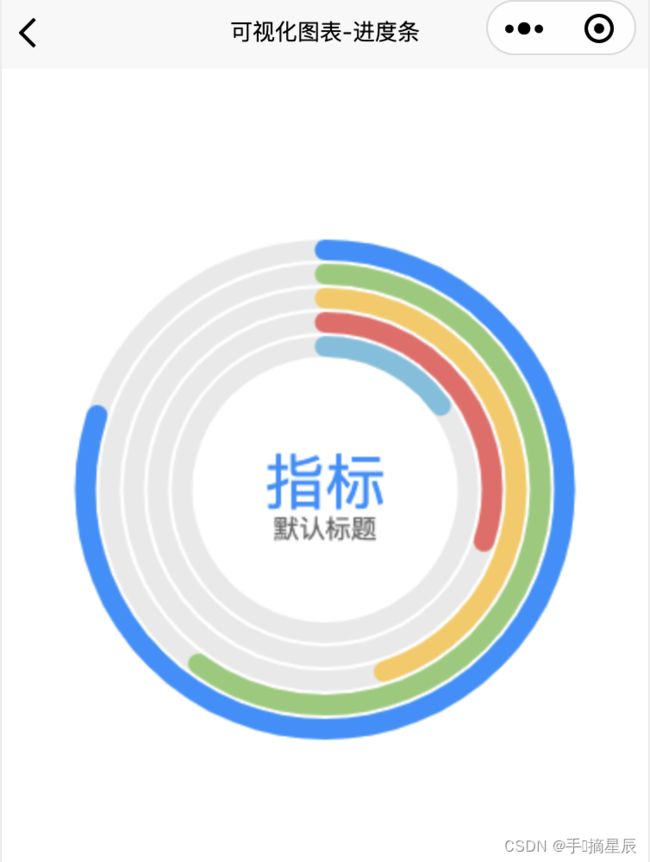
这里需要注意一下uCharts的组件使用,需要先安装组件插件或者自己去插件社区下载一个插件包,然后放到这个目录下就可以使用了,在页面里面使用标签通过设置type属性值区分图表类别,opts设置图表基本设置属性,chartData设置图表数据。

<template>
<view class="charts-box">
<qiun-data-charts
type="arcbar"
:opts="opts"
:chartData="chartData"
/>
</view>
</template>
<script>
export default {
data() {
return {
chartData: {},
opts: {
color: ["#1890FF","#91CB74","#FAC858","#EE6666","#73C0DE","#3CA272","#FC8452","#9A60B4","#ea7ccc"],
padding: undefined,
title: {
name: "指标",
fontSize: 35,
color: "#1890ff"
},
subtitle: {
name: "默认标题",
fontSize: 15,
color: "#666666"
},
extra: {
arcbar: {
type: "circle",
width: 12,
backgroundColor: "#E9E9E9",
startAngle: 1.5,
endAngle: 0.25,
gap: 2
}
}
}
};
},
onReady() {
this.getServerData();
},
methods: {
getServerData() {
setTimeout(() => {
let res = {
series: [
{
name: "一班",
data: 0.8
},
{
name: "二班",
data: 0.6
},
{
name: "三班",
data: 0.45
},
{
name: "四班",
data: 0.3
},
{
name: "五班",
data: 0.15
}
]
};
this.chartData = JSON.parse(JSON.stringify(res));
}, 500);
},
}
};
</script>
<style scoped>
.charts-box {
margin-top: 25%;
width: 100%;
height: 300px;
}
</style>
柱状图详情展示

<template>
<view class="charts-box">
<qiun-data-charts
type="bar"
:opts="opts"
:chartData="chartData"
/>
</view>
</template>
<script>
export default {
data() {
return {
chartData: {},
opts: {
color: ["#1890FF","#91CB74","#FAC858","#EE6666","#73C0DE","#3CA272","#FC8452","#9A60B4","#ea7ccc"],
padding: [15,30,0,5],
enableScroll: false,
legend: {},
xAxis: {
boundaryGap: "justify",
disableGrid: false,
min: 0,
axisLine: false,
max: 40
},
yAxis: {},
extra: {
bar: {
type: "group",
width: 30,
meterBorde: 1,
meterFillColor: "#FFFFFF",
activeBgColor: "#000000",
activeBgOpacity: 0.08,
linearType: "custom",
barBorderCircle: true,
seriesGap: 2,
categoryGap: 2
}
}
}
};
},
onReady() {
this.getServerData();
},
methods: {
getServerData() {
setTimeout(() => {
let res = {
categories: ["2018","2019","2020","2021","2022","2023"],
series: [
{
name: "目标值",
data: [35,36,31,33,13,34]
},
{
name: "完成量",
data: [18,27,21,24,6,28]
}
]
};
this.chartData = JSON.parse(JSON.stringify(res));
}, 500);
},
}
};
</script>
<style scoped>
.charts-box {
margin-top: 25%;
width: 100%;
height: 300px;
}
</style>
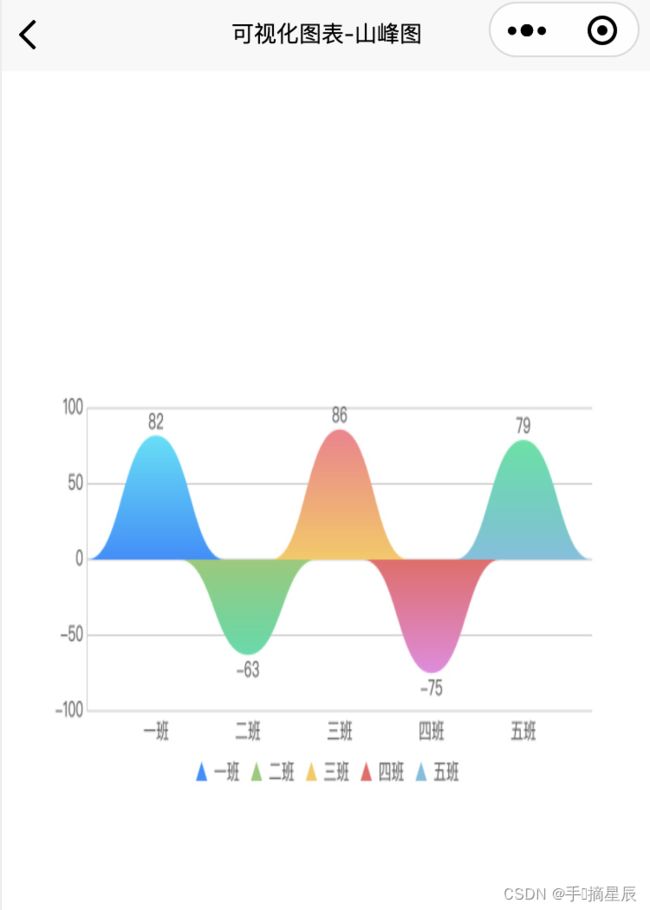
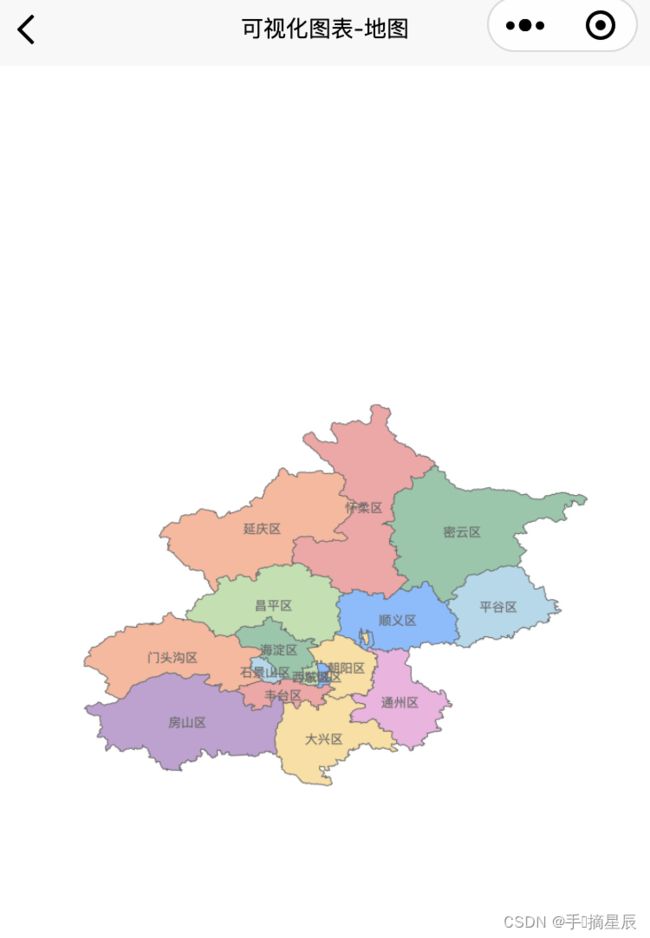
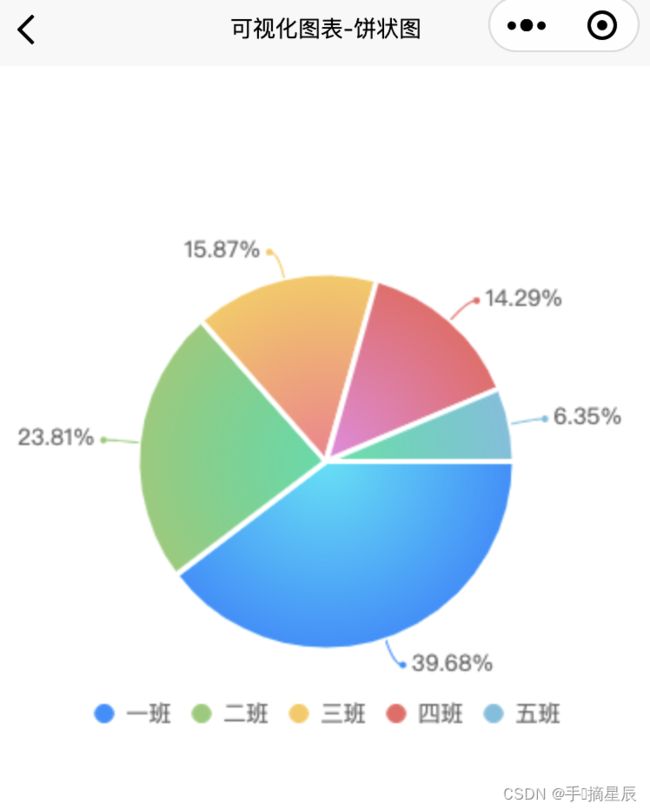
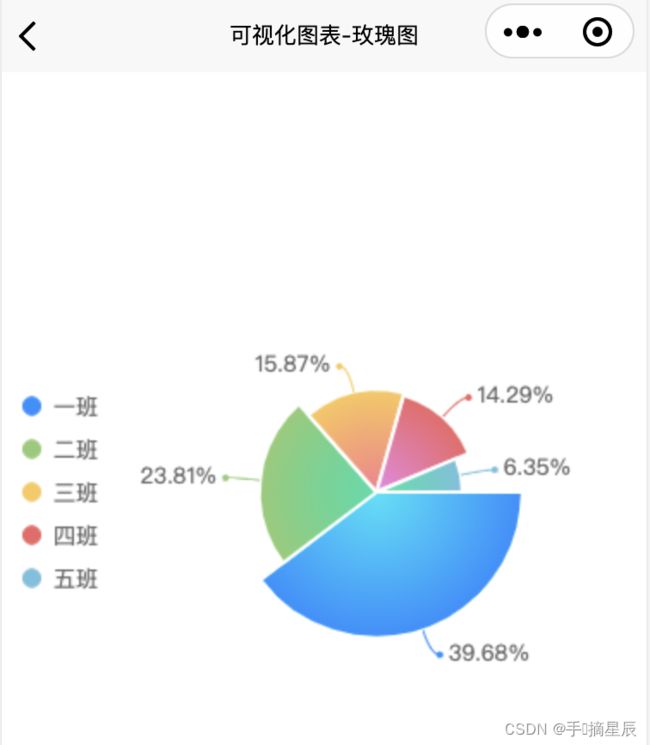
下面就是选取几种图形展示详情效果就不一一介绍代码了,详细的用法大家可以去秋云uCharts官网https://www.ucharts.cn/v2/#/demo/index
