ELK日志分析系统
文章目录
- ELK日志分析系统
-
- 1. ELK日志分析系统简介
-
- 1.1 ELK介绍
- 1.2 ELK工作原理
- 2. ELK(Elasticsearch, Logstash and Kibana)各个组件介绍
-
- 2.1 Elasticsearch介绍
-
- 2.1.1 Elasticsearch简介
- 2.1.2 Elasticsearch概念
- 2.1.3 为什么要采用分片
- 2.1.4 开启分片副本的主要原因
- 2.2 Logstash介绍
-
- 2.2.1 Logstash 简介
- 2.2.2 Logstash主要组件
- 2.3 Kibana介绍
-
- 2.3.1 Kibana 简介
- 2.3.2 Kibana 功能
- 3. 部署ELK
-
- 3.1 环境准备
- 3.2 部署Elasticsearch
- 3.3 管理Elasticsearch集群
-
- 3.3.1 管理Elasticsearch集群
- 3.3.2 安装Elasticsearch-head 插件
- 4. 部署ELK Logstash
-
- 4.1 部署ELK Logstash
- 4.2 定义 logstash配置文件
- 5. 部署ELK Kibana
-
- 5.1 部署Kibana
- 5.2 部署filebeat
ELK日志分析系统
1. ELK日志分析系统简介
1.1 ELK介绍
ELK日志分析系统是一套基于Elasticsearch、Logstash和Kibana三个开源工具的日志收集、存储、检索、分析和展示的解决方案。ELK可以帮助用户对分布式系统中的日志数据进行集中化管理,提高问题定位和数据分析的效率。ELK的主要组成部分和功能如下:
- Elasticsearch:一个分布式的搜索和分析引擎,可以对各种类型的数据进行近实时的索引和存储,支持高可用性、水平扩展和全文检索等特性。
- Logstash:一个数据处理管道,可以从多个来源采集数据,对数据进行过滤、转换和格式化,然后将数据发送到Elasticsearch或其他目的地。
- Kibana:一个针对Elasticsearch的可视化平台,可以通过各种图表和仪表盘对存储在Elasticsearch中的数据进行搜索、分析和展示。
ELK日志分析系统的架构可以根据不同的需求和场景进行调整,一般有以下几种模式:
- Beats + Elasticsearch + Kibana:这是一种简单的模式,适合对日志数据的处理需求不高的情况。Beats是一系列轻量级的数据收集器,可以从不同的数据源采集数据并直接发送到Elasticsearch,Kibana则负责对数据进行展示和分析。
- Beats + Logstash + Elasticsearch + Kibana:这是一种常见的模式,适合对日志数据的处理需求较高的情况。Beats将数据发送到Logstash,Logstash则负责对数据进行更复杂的处理和转换,然后将数据发送到Elasticsearch,Kibana则负责对数据进行展示和分析。
- Beats + 缓存/消息队列 + Logstash + Elasticsearch + Kibana:这是一种高可用和高性能的模式,适合对日志数据的处理需求非常高的情况。Beats将数据发送到缓存或消息队列,如Redis、Kafka或RabbitMQ,这样可以减轻对日志源和Elasticsearch的压力,提高数据的传输效率和安全性,同时也可以防止数据丢失。Logstash则从缓存或消息队列中获取数据,对数据进行更复杂的处理和转换,然后将数据发送到Elasticsearch,Kibana则负责对数据进行展示和分析。
1.2 ELK工作原理
-
在所有需要收集日志的服务器上部署Logstash;或者先将日志进行集中化管理在日志服务器上,在日志服务器上部署 Logstash
-
Logstash 收集日志,将日志格式化并输出到 Elasticsearch 群集中
-
Elasticsearch 对格式化后的数据进行索引和存储
-
Kibana 从 ES 群集中查询数据生成图表,并进行前端数据的展示
2. ELK(Elasticsearch, Logstash and Kibana)各个组件介绍
2.1 Elasticsearch介绍
2.1.1 Elasticsearch简介
Elasticsearch是一个基于开源的分布式搜索和分析引擎,採用Lucene作为底层搜索库。它被设计用于处理大规模数据集和实时数据的搜索、分析和可视化。Elasticsearch具有以下特点:
- 分布式架构:Elasticsearch使用分布式架构,数据可以分布在多个节点上,提供高可用性和横向扩展能力。它支持自动的数据分片和复制,以实现数据的分布和冗馀存储。
- 强大的搜索功能:Elasticsearch提供全文搜索和结构化搜索的能力。它支持复杂的查询语法和过滤器,可以根据相关性对搜索结果进行排名,支持实时搜索和自动补全。
- 多种数据类型支持:Elasticsearch可以存储和索引各种类型的数据,包括文本、数字、地理位置、日期等。它提供了丰富的分析和聚合功能,可以对数据进行统计、计算和可视化。
- 实时数据处理:Elasticsearch支持实时索引和实时查询,可以处理大规模、高速率的数据流。它可以与Logstash和Beats等工具集成,实现实时数据收集、处理和可视化。
- 可扩展性和可定制性:Elasticsearch提供了丰富的插件和API,可以扩展和定制功能。它支持数据的水平扩展,可以根据需求增加节点和集群的规模。
- 安全性和监控:Elasticsearch提供了安全性功能,可以对数据进行身份验证和授权。它还提供了监控和诊断工具,用于监控集群状态、性能和健康状况。
2.1.2 Elasticsearch概念
- 接近实时(NRT)
Elasticsearch是一个接近即时的搜索平台,从索引一个文档知道这个文档能够被搜索到的过程中有一个轻微的延迟(通常是1S) - 集群(cluster)
由一个及其以上的节点组织在一起,它们共同持有整个数据,并一起提供索引和搜索功能
其中一个节点为主节点,这个节点是可以通过选举产生,并提供跨节点的联合索引和搜索的功能
集群有一个唯一标识的名字,默认是elaticsearch
集群名字很重要,每个节点是基于集群名字加入到其集群中;因此,要确保集群的唯一性,在不同环境中使用不同的集群名字
一个集群只可以有一个节点,建议在配置elasticsearch时,配置成集群模式
- 节点(node)
节点就是一台单一的服务器,是集群的一部分,存储数据并参与集群的索引和搜索功能
像集群一样,节点之间可是通过名字来标识区分,默认是在节点启动时随机分配的字符名
当然,你可以自己定义,该名字很重要,起到在集群中定位到对应的节点
节点可以通过指定集群名字来加入到集群中,默认情况下,每个节点被设置成加入到elasticsearch集群。
如果启动了多个节点,假设能够自动发现对方,他们将会自动组建一个名为elastisearch的集群
索引(index)——索引(库)——类型(表)——文档(记录)
一个索引就是一个拥有几分相似特征的文档的集合
比如说,你可以有一个客户数据的索引、一个产品目录的索引、还有一个订单数据的索引
一个索引用一个名字来标识(必须全部是小写字母组合),并且当我们要对相应的索引中的文档进行索引、收缩、更新和删除的时候,都要用到这个名字
在一个集群中,可以定义多个索引
-
类型(type)
在一个索引中,你可以定义一种或多种类型
一个类型是你的索引的一个逻辑上的分类分区,其寓意完全由你来定义
通常,会为具有一组共同字段的文档定义一个类型
比如:我们假设运营一个博客平台并且将所有的数据存储到一个索引中,在这个索引中,你可以为用户数据定义一个类型,为博客数据定义一个类型,也可以为评论数据定义另一个类型
- 文档(Document)
一个文档是一个可被索引的基础信息单元
比如:你可以拥有一个客户的文档,某一个产品的文档;文档以JSON(Javascript Object Notation)格式来表示,json是一个通用的互联网数据交互模式
在一个index/type内,你可以存储任意多的文档
注意:虽然一个文档在物理上位于一个索引内,但是实际上一个文档必须在一个索引内可以被索引和分配一个类型
- 分片和副本 (shards & replicas)
在实际情况下,索引存储的数据可能超过单个节点的硬件设置
比如十亿个文档需要1TB空间存储,可能不适合存储在单个节点上,读写被限制在单个节点;从单个节点搜索请求也太慢了
为了解决这个问题,elasticsearch集群提供将索引分割开,进行分片的功能
当创建索引时,可以定义想要分片的数量
每一个分片就是一个全功能的独立的索引,可以位于集群中的任何节点上
2.1.3 为什么要采用分片
1.可以进行水平分割横向扩展,增大存储量
2.分布式并行跨分片操作,提高性能和吞吐量
2.1.4 开启分片副本的主要原因
1.高可用性,以应对分片或者节点故障,处于这个原因,分片副本要在不同节点上
2.提高IO性能,增大吞吐量,搜索可以并行在所有副本执行
1.总之,每个索引可以被分成多个分片,一个索引也可以被复制0次或者多次
2.一旦复制了,每个索引就有了主分片(可以作为复制源的原始分片)和复制分片(主分片的拷贝)之分
3.分片和副本的数量可以在索引创建的时候指定,在索引创建之后,你可以在任何时候动态改变副本的数量,但是你事后无法改变分片的数量
4.默认情况下,Elasticsearch中的每个索引被分片为5个主分片和1个副本,这意味着,如果你的集群中至少有两个节点的情况下,你的索引将会有5个主分片和另外5个副本分片(1个完全拷贝),这样的话每个索引总共就有10个分片
2.2 Logstash介绍
2.2.1 Logstash 简介
Logstash是一个开源的数据收集引擎,可以实时地将数据从不同来源进行收集、转换和发送。它是ELK(Elasticsearch, Logstash and Kibana)堆栈的一个重要组件。
Logstash主要功能包括:
- 数据收集:Logstash可以从多种来源收集数据,包括日志文件、数据库、消息队列等。它支持各种输入插件,可以从这些来源接收数据。
- 数据转换:Logstash具有强大的数据转换功能,可以对收集到的数据进行格式化、解析和过滤等操作。它支持多种过滤器插件,如grok、mutate等,用于对数据进行处理和转换。
- 数据输出:Logstash可以将处理后的数据输出到不同的目标。最常见的是将数据输出到Elasticsearch进行索引和搜索。它还支持其他输出插件,如文件、消息队列、关系型数据库等。
- 插件生态系统:Logstash拥有丰富的插件生态系统,可以扩展其功能。用户可以根据需要安装和配置各种插件,以满足特定的数据处理需求。
2.2.2 Logstash主要组件
- Shipper:日志收集
负责监控本地日志文件的变化,及时把日志文件的最新内容收集起来
通常,远程代理端(agent)只需要运行这个组件即可
-
Indexer:日志存储
负责接受日志并写入到本地文件 -
Input Plugins:输入插件
输入插件用于从各种来源收集数据。它们可以接收数据流并将其传递给Logstash进行处理。常见的输入插件包括File(文件输入)、Beats(用于接收Beats数据)、Syslog(用于接收Syslog消息)等。 -
Filter Plugins:过滤器插件
过滤器插件用于对输入数据进行转换、解析和过滤。它们允许用户对数据进行各种操作,如结构化解析、字段分割、数据处理和转换等。常见的过滤器插件包括Grok(用于解析结构化日志)、Mutate(用于修改字段值)等。 -
Output Plugins:输出插件
-
输出插件用于将处理后的数据发送到各种目的地。它们将数据传输到外部系统或存储库,如Elasticsearch、文件、消息队列等。常见的输出插件包括Elasticsearch(用于索引数据到Elasticsearch)、File(文件输出)等。
-
Broker:日志hub
负责链接多个shipper和对应数目的indexer -
Search and Storage
允许对事件进行搜索和存储 -
Web Interface
基于web的展示界面
以上组件在lLogstash架构中可以独立部署,因此提供了很好的集群扩展性。除了这些主要组件外,Logstash还提供了许多插件和扩展,以满足更多的数据处理需求。用户可以根据自己的需求选择和配置适合的组件和插件,定制化Logstash的功能和行为。
2.3 Kibana介绍
2.3.1 Kibana 简介
Kibana是一个开源的数据可视化和分析平台,通常与Elasticsearch一起使用。它提供了一个用于搜索、分析和视觉化大量数据的界面。Kibana可以让用户通过直观的图形和图表来探索数据,从而更好地理解数据中的模式、趋势和关联性。
Kibana支援多种视觉化工具,包括条形图、折线图、圆饼图、地图、散点图等,用户可以根据自己的需求和数据类型来选择合适的视觉化方式。此外,Kibana还提供了一个强大的查询和过滤功能,让用户可以通过简单的搜索和过滤条件来缩小数据集的范围,从而进一步分析数据。
Kibana还支援仪表板功能,用户可以根据自己的需要设计和定制仪表板,将不同的视觉化元素和图表组合在一起,以便于实时监控和呈现数据的状态和趋势。
除了数据可视化和分析外,Kibana还提供了日志和事件管理的功能,用于查看、搜索和分析日志数据,以及进行事件监控和报警。
2.3.2 Kibana 功能
- 数据可视化:Kibana提供多种图表和视觉化工具,用户可以通过图表、图形和地图等形式来展示和呈现数据,从而更好地理解数据的模式和关联性。
- 数据探索和分析:Kibana支持强大的查询和过滤功能,使用户可以通过简单的搜索和过滤条件来探索数据集,并进行数据分析和挖掘。
- 仪表板设计:Kibana允许用户根据需要自定义和设计仪表板,将不同的可视化元素和图表组合在一起,实现对数据的实时监控和呈现。
- 日志和事件管理:Kibana提供日志和事件管理功能,用于查看、搜索和分析大量的日志数据,并实现事件监控和报警等功能。
- 安全和用户管理:Kibana支持安全功能,包括用户身份验证、角色管理和访问控制,保护数据的安全性和隐私性。
- 整合Elastic Stack:Kibana与Elastic Stack的其他组件(如Elasticsearch、Logstash和Beats)紧密集成,提供了一个完整的数据分析和管理平台。
3. 部署ELK
环境说明
| 主机名 | ip | 角色 | 系统版本 |
|---|---|---|---|
| master | 192.168.234.33 | Logstash Apache Kibana | CentOS8 |
| kiwi111 | 192.168.234.123 | Elasticsearch 8.11 | CentOS8 |
| kiwi222 | 192.168.234.111 | Elasticsearch 8.11 | CentOS8 |
官方安装Elasticsearch8.11版本指南
Logstash官方下载指南
Kibana官方下载指南
3.1 环境准备
//关闭三台节点的防火墙
//master主机
[root@master ~]# systemctl disable --now firewalld
[root@master ~]# setenforce 0
[root@master ~]# sed -i 's/^SELINUX=enforcing/SELINUX=disabled/g' /etc/selinux/config

//kiwi111节点
[root@kiwi111 ~]# systemctl disable --now firewalld
[root@kiwi111 ~]# setenforce 0
[root@kiwi111 ~]# sed -i 's/^SELINUX=enforcing/SELINUX=disabled/g' /etc/selinux/config

//kiwi222节点
[root@kiwi222 ~]# systemctl disable --now firewalld
[root@kiwi222 ~]# setenforce 0
[root@kiwi222 ~]# sed -i 's/^SELINUX=enforcing/SELINUX=disabled/g' /etc/selinux/config


//添加域名解析,三台节点都要配置
//master节点
[root@master ~]# vim /etc/hosts
192.168.234.33 master
192.168.234.123 kiwi111
192.168.234.111 kiwi222

//kiwi111节点
[root@kiwi111 ~]# vim /etc/hosts
192.168.234.33 master
192.168.234.123 kiwi111
192.168.234.111 kiwi222

//kiwi222节点
[root@kiwi222 ~]# vim /etc/hosts
192.168.234.33 master
192.168.234.123 kiwi111
192.168.234.111 kiwi222


//配置时间同步
//master节点
[root@master ~]# yum install -y chrony
[root@master ~]# systemctl enable --now chronyd
[root@master ~]# timedatectl set-timezone Asia/Shanghai  ##修改时区
[root@master ~]# vim /etc/chrony.conf
·······················略
# Please consider joining the pool (http://www.pool.ntp.org/join.html).
pool time1.aliyun.com iburst iburst  ## 修改这一行
·······················略
[root@master ~]# systemctl restart chronyd

//kiwi111节点
[root@kiwi111 ~]# yum install -y chrony
[root@kiwi111 ~]# systemctl enable --now chronyd
[root@kiwi111 ~]# timedatectl set-timezone Asia/Shanghai
[root@kiwi111 ~]# vim /etc/chrony.conf
·······················略
# Please consider joining the pool (http://www.pool.ntp.org/join.html).
pool master iburst    ## 修改这一行
·······················略
[root@kiwi111 ~]# systemctl restart chronyd

//kiwi222节点
[root@kiwi222 ~]# yum install -y chrony
[root@kiwi222 ~]# systemctl enable --now chronyd
[root@kiwi222 ~]# timedatectl set-timezone Asia/Shanghai
[root@kiwi222 ~]# vim /etc/chrony.conf
·······················略
# Please consider joining the pool (http://www.pool.ntp.org/join.html).
pool master iburst    ## 修改这一行
·······················略
[root@kiwi222 ~]# systemctl restart chronyd


//设置免密登录
//master
[root@master ~]# ssh-keygen -t rsa
[root@master ~]# ssh-copy-id master
[root@master ~]# ssh-copy-id kiwi111
[root@master ~]# ssh-copy-id kiwi222

//验证
[root@master ~]# for i in master kiwi111 kiwi222;do ssh $i 'chronyc sources && date';done
MS Name/IP address         Stratum Poll Reach LastRx Last sample
===============================================================================
^* 203.107.6.88                  2   6   177    53  +2810us[+5030us] +/-   26ms
Mon Nov 20 16:06:41 CST 2023
MS Name/IP address         Stratum Poll Reach LastRx Last sample
===============================================================================
^? master                        0   8     0     -     +0ns[   +0ns] +/-    0ns
Mon Nov 20 16:06:41 CST 2023
MS Name/IP address         Stratum Poll Reach LastRx Last sample
===============================================================================
^? master                        0   7     0     -     +0ns[   +0ns] +/-    0ns
Mon Nov 20 16:06:42 CST 2023
[root@master ~]#


//由于ELK及其组件需要Java环境支持,所以要在所有节点上安装JDK
[root@master ~]# yum install -y java
[root@kiwi111 ~]# yum install -y java
[root@kiwi222 ~]# yum install -y java
3.2 部署Elasticsearch
在kiwi111与kiwi222节点上部署
//kiwi111节点
//创建elasticsearch系统用户
[root@kiwi111 ~]# groupadd -r elasticsearch
[root@kiwi111 ~]# useradd -r -M -s /sbin/nologin -g elasticsearch elasticsearch

//获取软件包
[root@kiwi111 ~]# wget https://artifacts.elastic.co/downloads/elasticsearch/elasticsearch-8.11.1-linux-x86_64.tar.gz

//解压
[root@kiwi111 ~]# tar -xf elasticsearch-8.11.1-linux-x86_64.tar.gz -C /usr/local/

//创建软连接
[root@kiwi111 ~]# cd /usr/local/
[root@kiwi111 local]# ln -s elasticsearch-8.11.1/ elasticsearch

//创建Elasticsearch数据存放目录
[root@kiwi111 ~]# mkdir -p /data/elk-es

//修改目录属主属组
[root@kiwi111 ~]# chown -R elasticsearch:elasticsearch /data/elk-es/

//创建Elasticsearch日志存放目录
[root@kiwi111 ~]# cd /var/log/
[root@kiwi111 log]# mkdir elasticsearch/

//修改目录属主属组
[root@kiwi111 log]# chown -R elasticsearch:elasticsearch elasticsearch/

//编辑配置文件
[root@kiwi111 ~]# cd /usr/local/elasticsearch/config/
[root@kiwi111 config]# cp elasticsearch.yml elasticsearch.yml.bak  ## 备份

//开始编辑
以下所有内容都可以注释可添加
[root@kiwi111 config]# vim elasticsearch.yml
[root@kiwi111 config]# cat elasticsearch.yml
# ======================== Elasticsearch Configuration =========================
#
# NOTE: Elasticsearch comes with reasonable defaults for most settings.
#       Before you set out to tweak and tune the configuration, make sure you
#       understand what are you trying to accomplish and the consequences.
#
# The primary way of configuring a node is via this file. This template lists
# the most important settings you may want to configure for a production cluster.
#
# Please consult the documentation for further information on configuration options:
# https://www.elastic.co/guide/en/elasticsearch/reference/index.html
#
# ---------------------------------- Cluster -----------------------------------
#
# Use a descriptive name for your cluster:
#
#cluster.name: my-application
cluster.name: kiwi-elk-cluster     ## 指定集群名称
#
# ------------------------------------ Node ------------------------------------
#
# Use a descriptive name for the node:
#
#node.name: node-1
node.name: kiwi111                 ## 指定第一个节点名称
#
# Add custom attributes to the node:
#
#node.attr.rack: r1
#
# ----------------------------------- Paths ------------------------------------
#
# Path to directory where to store the data (separate multiple locations by comma):
#
#path.data: /path/to/data
path.data: /data/elk-es            ## 指定数据存放目录
#
# Path to log files:
#
#path.logs: /path/to/logs
path.logs: /var/log/elasticsearch/    ## 指定日志存放目录
# ----------------------------------- Memory -----------------------------------
#
# Lock the memory on startup:
#
#bootstrap.memory_lock: true
bootstrap.memory_lock: false        ## 更改为false
#
# Make sure that the heap size is set to about half the memory available
# on the system and that the owner of the process is allowed to use this
# limit.
#
# Elasticsearch performs poorly when the system is swapping the memory.
#
# ---------------------------------- Network -----------------------------------
#
# By default Elasticsearch is only accessible on localhost. Set a different
# address here to expose this node on the network:
#
#network.host: 192.168.0.1
network.host: 0.0.0.0               ## 指定监听,0.0.0.0表示监听所有
#
# By default Elasticsearch listens for HTTP traffic on the first free port it
# finds starting at 9200. Set a specific HTTP port here:
#
http.port: 9200                     ## 指定端口
#
# For more information, consult the network module documentation.
#
# --------------------------------- Discovery ----------------------------------
#
# Pass an initial list of hosts to perform discovery when this node is started:
# The default list of hosts is ["127.0.0.1", "[::1]"]
#
#discovery.seed_hosts: ["host1", "host2"]
discovery.seed_hosts: ["192.168.234.123","192.168.234.111"]    ## 发现节点
#
# Bootstrap the cluster using an initial set of master-eligible nodes:
#
#cluster.initial_master_nodes: ["node-1", "node-2"]
cluster.initial_master_nodes: ["kiwi111","kiwi222"]     ## 配置ES集群初始化时参与master选举的节点名称列表,必须与node.name配置的一致。ES集群首次构建完成后,应该将集群中所有节点的配置文件中的cluster.initial_master_nodes配置项移除,重启集群或者将新节点加入某个已存在的集群时切记不要设置该配置项。
#
# For more information, consult the discovery and cluster formation module documentation.
#
# ---------------------------------- Various -----------------------------------
#
# Allow wildcard deletion of indices:
#
#action.destructive_requires_name: false
xpack.security.enabled: false      ## 不使用安全功能并禁用SSL加密,如果没有证书这项必须添加
xpack.security.http.ssl.enabled: false   ## 不使用安全功能并禁用SSL加密,如果没有证书这项必须添加


//将这个目录的属主属组改为elasticsearch
[root@kiwi111 ~]# cd /usr/local/
[root@kiwi111 local]# chmod -R elasticsearch:elasticsearch elasticsearch-8.11.1/


//由于不推荐使用root运行,所以需要用创建的用户运行
[root@kiwi111 elasticsearch]# su elasticsearch -c "/usr/local/elasticsearch/bin/elasticsearch -d"


//编写service文件以设置开机自启
[root@kiwi111 ~]# cat /usr/lib/systemd/system/elasticsearch.service
[Unit]
Description=elasticsearch server daemon
After=network.target

[Service]
Type=forking
User=elasticsearch
ExecStart=/usr/local/elasticsearch/bin/elasticsearch -d
PrivateTmp=true
LimitNOFILE=65535
LimitNPROC=65535
LimitAS=infinity
LimitFSIZE=infinity
TimeoutStopSec=0
KillSignal=SIGTERM
KillMode=process
SendSIGKILL=no
SuccessExitStatus=143

[Install]
WantedBy=multi-user.target


//设置开机自启
[root@kiwi111 ~]# systemctl enable elasticsearch
Created symlink /etc/systemd/system/multi-user.target.wants/elasticsearch.service → /usr/lib/systemd/system/elasticsearch.service.
kiwi222主机同以上步骤
3.3 管理Elasticsearch集群
3.3.1 管理Elasticsearch集群
在web页面上访问,访问时加上9200端口,192.168.234.123:9200

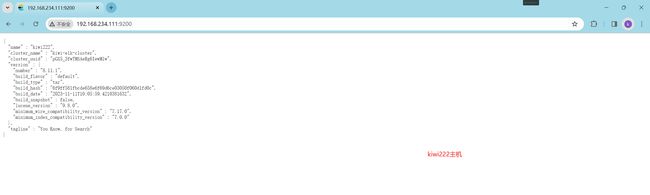
访问192.168.234.123:9200/_cluster/health?pretty 查看集群的健康状况

访问192.168.234.123:9200/_cluster/state?pretty 检查集群状态信息

不过用以上方式查看集群的状态对用户不友好,可以通过安装Elasticsearch-head 插件,来更方便的管理集群
3.3.2 安装Elasticsearch-head 插件
//注意:Elasticsearch 在 5.0 版本后,Elasticsearch-head 插件需要作为独立服务进行安装,需要使用npm工具(NodeJS的包管理工具)安装。

//安装 Elasticsearch-head 需要提前安装好依赖软件 node 和 phantomjs。

//node:是一个基于 Chrome V8 引擎的 JavaScript 运行环境。

//phantomjs:是一个基于 webkit 的JavaScriptAPI,可以理解为一个隐形的浏览器,任何基于 webkit 浏览器做的事情,它都可以做到。
nodejs官方下载地址
安装nodejs
//获取nodejs软件包
[root@kiwi111 ~]# wget https://nodejs.org/dist/v21.2.0/node-v21.2.0-linux-x64.tar.xz

//解压并创建软连接
[root@kiwi111 ~]# tar xf node-v21.2.0-linux-x64.tar.xz -C /usr/local/
[root@kiwi111 local]# ln -s node-v21.2.0-linux-x64/ node

//设置环境变量
[root@kiwi111 bin]# echo 'export PATH=/usr/local/node/bin:$PATH' > /etc/profile.d/node.sh
[root@kiwi111 bin]# source /etc/profile.d/node.sh
安装ES-head
//获取es-head
[root@kiwi111 ~]# git clone https://github.com/mobz/elasticsearch-head.git

[root@kiwi111 ~]# cd elasticsearch-head

//安装bzip2
[root@kiwi111 elasticsearch-head]# yum install -y bzip2

//安装
[root@kiwi111 elasticsearch-head]# npm install grunt --registry=https://registry.npm.taobao.org

//修改 Elasticsearch 主配置文件
[root@kiwi111 ~]# vim /usr/local/elasticsearch/config/elasticsearch.yml
## 在文件的最后一行添加下面两行
http.cors.enabled: true             #开启跨域访问支持,默认为 false
http.cors.allow-origin: "*"         #指定跨域访问允许的域名地址为所有

//重启ES服务
[root@kiwi111 ~]# systemctl restart elasticsearch

//启动elasticsearch-head
[root@kiwi111 ~]# npm run start &


//kiwi222主机步骤同上
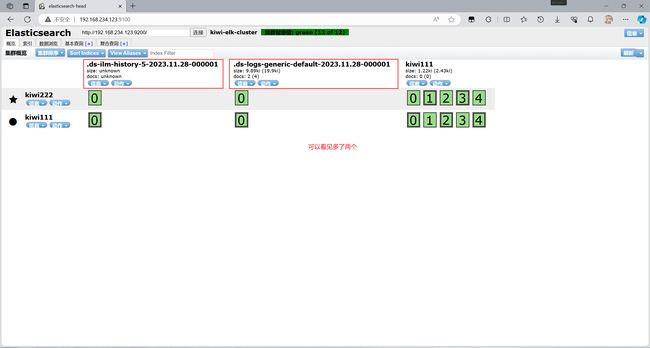
在web页面访问9100端口看能否正常访问


新建索引来查询


创建成功

另一台节点也会同步

4. 部署ELK Logstash
4.1 部署ELK Logstash
在master节点上部署(需要部署apache)
Logstash官方下载指南
Logstash 命令常用选项:
-f:通过这个选项可以指定 Logstash 的配置文件,根据配置文件配置 Logstash 的输入和输出流。
-e:从命令行中获取,输入、输出后面跟着字符串,该字符串可以被当作 Logstash 的配置(如果是空,则默认使用 stdin 作为输入,stdout 作为输出)。
-t:测试配置文件是否正确,然后退出。


//安装httpd
[root@master ~]# yum install -y httpd
[root@master ~]# systemctl enable --now httpd


//安装Logstash
[root@master ~]# rpm --import https://artifacts.elastic.co/GPG-KEY-elasticsearch
[root@master ~]# vim /etc/yum.repos.d/repologstash.repo
[logstash-8.x]
name=Elastic repository for 8.x packages
baseurl=https://artifacts.elastic.co/packages/8.x/yum
gpgcheck=1
gpgkey=https://artifacts.elastic.co/GPG-KEY-elasticsearch
enabled=1
autorefresh=1
type=rpm-md
[root@master ~]# yum install -y logstash

//启动服务并设置开机自启
[root@master ~]# systemctl enable --now logstash

//创建软连接
[root@master ~]# ln -s /usr/share/logstash/bin/logstash /usr/local/bin/


//测试Logstash
1. #输入采用标准输入,输出采用标准输出(类似管道)
[root@master ~]# logstash -e 'input { stdin{} } output { stdout{} }'
Using bundled JDK: /usr/share/logstash/jdk
WARNING: Could not find logstash.yml which is typically located in

···········································略

www.baidu.com                           ## 输入这个之后按回车
{
       "message" => "www.baidu.com",
    "@timestamp" => 2023-11-28T07:12:33.466920428Z,
      "@version" => "1",
          "host" => {
        "hostname" => "master"
    },
         "event" => {
        "original" => "www.baidu.com"
    }
}
//执行 ctrl+c 退出

2. #使用 rubydebug 输出详细格式显示,codec为一种编解码器
[root@master ~]# logstash -e 'input { stdin{} } output { stdout{ codec=>rubydebug } }'
Using bundled JDK: /usr/share/logstash/jdk
WARNING: Could not find logstash.yml which is typically located in

············································略

www.baidu.com
{
       "message" => "www.baidu.com",
    "@timestamp" => 2023-11-28T07:16:58.685738776Z,
         "event" => {
        "original" => "www.baidu.com"
    },
          "host" => {
        "hostname" => "master"
    },
      "@version" => "1"
}

3. # 使用 Logstash 将信息写入 Elasticsearch 中
[root@master ~]# logstash -e 'input { stdin{} } output { elasticsearch { hosts=>["192.168.234.123:9200"] }}'
Using bundled JDK: /usr/share/logstash/jdk
WARNING: Could not find logstash.yml which is typically located in $LS_HOME/config or /etc/logstash. You can specify the path using --path.settings. Continuing using the defaults

·······································略
www.baidu.com                        #输入内容(标准输入)
www.google.com                       #输入内容(标准输入)

//结果不在标准输出显示,而是发送至Elasticsearch 中,可浏览器访问 http://192.168.234.123:9100/ 查看索引信息和数据浏览。
在web端查看是否发送成功
其中一条是baidu.com数据

另一条则是google.com数据

4.2 定义 logstash配置文件
Logstash 配置文件基本由三部分组成:input、output 以及 filter(可选,根据需要选择使用)。
//格式如下:
input {...}
filter {...}
output {...}
在每个部分中,也可以指定多个访问方式。例如,若要指定两个日志来源文件,
//则格式如下:
input {
file { path =>"/var/log/messages" type =>"syslog"}
file { path =>"/var/log/httpd/access.log" type =>"apache"}
}
// 让 Logstash 可以读取日志
[root@master ~]# chmod +r /var/log/messages
//修改 Logstash 配置文件,让其收集系统日志/var/log/messages,并将其输出到 elasticsearch 中。
# 注:该文件需要手动创建一个
[root@master ~]# vim /etc/logstash/conf.d/system.conf
[root@master ~]# cat /etc/logstash/conf.d/system.conf
input {
file{
path =>"/var/log/messages" #指定要收集的日志的位置
type =>"system" #自定义日志类型标识
start_position =>"beginning" #表示从开始处收集
}
}
output {
elasticsearch { #输出到 elasticsearch
hosts => ["192.168.234.123:9200"] #指定 elasticsearch 服务器的地址和端口
index =>"system-%{+YYYY.MM.dd}" #指定输出到 elasticsearch 的索引格式
}
}
//重启服务
[root@master ~]# systemctl restart logstash
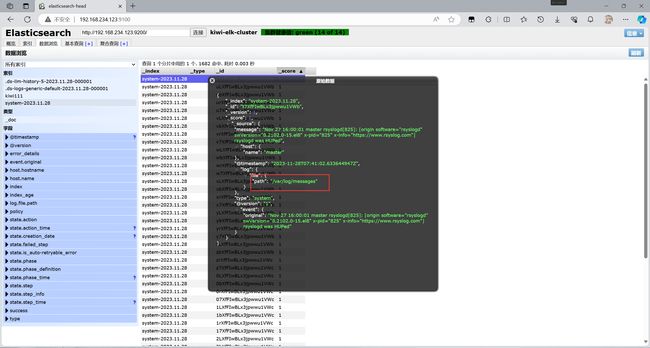
//用浏览器访问,查看索引信息
在浏览器访问192.168.234.123:9100 查看信息

可以看见这是/var/log/messages的日志信息
5. 部署ELK Kibana
5.1 部署Kibana
在master节点上部署(需要部署apache)
Kibana官方下载指南
//部署Kibana
[root@master ~]# rpm --import https://artifacts.elastic.co/GPG-KEY-elasticsearch
[root@master ~]# vim /etc/yum.repos.d/kibana.repo[root@master ~]# rpm --import https://artifacts.elastic.co/GPG-KEY-elasticsearch
[root@master ~]# vim /etc/yum.repos.d/kibana.repo
[kibana-8.x]
name=Kibana repository for 8.x packages
baseurl=https://artifacts.elastic.co/packages/8.x/yum
gpgcheck=1
gpgkey=https://artifacts.elastic.co/GPG-KEY-elasticsearch
enabled=1
autorefresh=1
type=rpm-md
[root@master ~]# yum install -y kibana
配置Kibana的主配置文件
//备份
[root@master ~]# cp /etc/kibana/kibana.yml /etc/kibana/kibana.yml_backup

//配置
[root@master ~]# vim /etc/kibana/kibana.yml
[root@master ~]# cat /etc/kibana/kibana.yml
# For more configuration options see the configuration guide for Kibana in
# https://www.elastic.co/guide/index.html

# =================== System: Kibana Server ===================
# Kibana is served by a back end server. This setting specifies the port to use.
server.port: 5601        ## 取消注释,Kiabana 服务的默认监听端口为5601

# Specifies the address to which the Kibana server will bind. IP addresses and host names are both valid values.
# The default is 'localhost', which usually means remote machines will not be able to connect.
# To allow connections from remote users, set this parameter to a non-loopback address.
server.host: "0.0.0.0"    ## 取消注释,设置 Kiabana 的监听地址,0.0.0.0代表所有地址


# =================== System: Elasticsearch ===================
# The URLs of the Elasticsearch instances to use for all your queries.
elasticsearch.hosts: ["http://192.168.234.123:9200","http://192.168.234.111:9200"]   ## 取消注释,设置和 Elasticsearch 建立连接的地址和端口

······································略

# Specifies locale to be used for all localizable strings, dates and number formats.
# Supported languages are the following: English (default) "en", Chinese "zh-CN", Japanese "ja-JP", French "fr-FR".
i18n.locale: "zh-CN"                ## 设置为kibanaweb页面为中文

//启动服务并设置开机自启
//在浏览器输入192.168.234.33:5601访问kibana
在浏览器访问

输入命令查看节点信息


GET /_cat/nodes?v

//基本命令
#查看集群中节点信息
GET /_cat/nodes?v
#查看集群中的索引信息
GET _cat/indices?v
5.2 部署filebeat
在kiwi111节点部署
filebeat官方下载指南
//部署filebeat
[root@kiwi111 ~]# rpm --import https://packages.elastic.co/GPG-KEY-elasticsearch
[root@kiwi111 ~]# vim /etc/yum.repos.d/filebeat.repo
[elastic-8.x]
name=Elastic repository for 8.x packages
baseurl=https://artifacts.elastic.co/packages/8.x/yum
gpgcheck=1
gpgkey=https://artifacts.elastic.co/GPG-KEY-elasticsearch
enabled=1
autorefresh=1
type=rpm-md
[root@master ~]# yum install -y filebeat


//启动服务并设置开机自启
[root@kiwi111 ~]# systemctl enable --now filebeat
设置filebeat的主配置文件
//备份
[root@kiwi111 ~]# cp /etc/filebeat/filebeat.yml /etc/filebeat/filebeat.yml_backup

//配置

filebeat.inputs:                   #定义日志输入的开始

# Each - is an input. Most options can be set at the input level, so
# you can use different inputs for various configurations.
# Below are the input-specific configurations.

# filestream is an input for collecting log messages from files.
- type: log

  # Unique ID among all inputs, an ID is required.
  # id: my-filestream-id

  # Change to true to enable this input configuration.
  enabled: true           #使用手动模式,如果false将使用modules.d目录下的模块方式

  # Paths that should be crawled and fetched. Glob based paths.
  paths:                  #要收集的日志的路径
    - /var/log/*.log
    - /var/log/message


output.elasticsearch:
  # Array of hosts to connect to.
        hosts: ["192.168.234.123:9200","192.168.234.111:9200"]   ## ES集群ip地址


//重启服务
[root@kiwi111 ~]# systemctl restart filebeat
通过head插件可以看到,已经成功有filebeat的索引

[root@master ~]# vim /etc/logstash/conf.d/filebeat.conf
[root@master ~]# logstash -f /etc/logstash/conf.d/filebeat.conf
查看日志信息
先创建一个字段
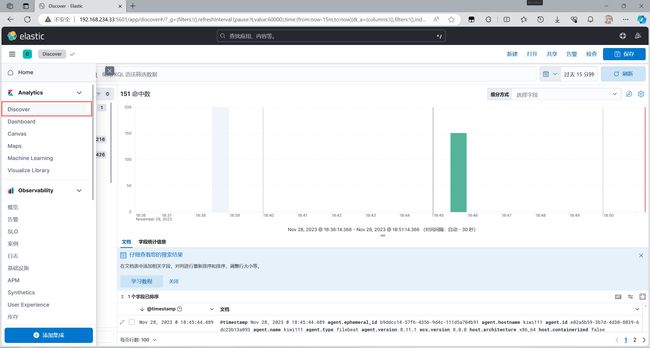
保存即可

可以看见已经有数据了

这里也可查看
