【机器学习】聚类(三):原型聚类:高斯混合聚类
文章目录
- 一、实验介绍
-
- 1. 算法流程
- 2. 算法解释
- 3. 算法特点
- 4. 应用场景
- 5. 注意事项
- 二、实验环境
-
- 1. 配置虚拟环境
- 2. 库版本介绍
- 三、实验内容
-
- 0. 导入必要的库
- 1. 全局调试变量
- 2. 调试函数
- 3. 高斯密度函数(phi)
- 4. E步(getExpectation)
- 5. M步(maximize)
- 6. 数据缩放函数
- 7. 初始化参数
- 8. GMM EM算法函数
- 9. 主函数
- 四、代码整合
高斯混合聚类是一种基于概率模型的聚类方法,采用多个高斯分布的线性组合来表示数据的聚类结构。通过对每个样本的多个高斯分布进行加权组合,该算法能够更灵活地适应不同形状的聚类。
一、实验介绍
1. 算法流程
- 初始化:
初始化高斯混合分布的模型参数,包括每个高斯混合成分的均值向量 μ i \mu_i μi、协方差矩阵 Σ i \Sigma_i Σi 和混合系数 π i \pi_i πi。
{ ( μ 1 , Σ 1 , π 1 ) , ( μ 2 , Σ 2 , π 2 ) , . . . , ( μ k , Σ k , π k ) } \{(\mu_1, \Sigma_1, \pi_1), (\mu_2, \Sigma_2, \pi_2), ..., (\mu_k, \Sigma_k, \pi_k)\} {(μ1,Σ1,π1),(μ2,Σ2,π2),...,(μk,Σk,πk)}
-
迭代过程(EM算法):
- Expectation (E) 步骤:
对于每个样本 X j X_j Xj 计算其由各混合成分生成的后验概率 γ i j \gamma_{ij} γij,表示样本属于第 i i i 个混合成分的概率。
γ i j = π i ⋅ N ( X j ∣ μ i , Σ i ) ∑ l = 1 k π l ⋅ N ( X j ∣ μ l , Σ l ) \gamma_{ij} = \frac{\pi_i \cdot \mathcal{N}(X_j | \mu_i, \Sigma_i)}{\sum_{l=1}^{k} \pi_l \cdot \mathcal{N}(X_j | \mu_l, \Sigma_l)} γij=∑l=1kπl⋅N(Xj∣μl,Σl)πi⋅N(Xj∣μi,Σi)
- Maximization (M) 步骤:
更新模型参数:- 新均值向量 μ i \mu_i μi 的更新: μ i = ∑ j = 1 m γ i j X j ∑ j = 1 m γ i j \mu_i = \frac{\sum_{j=1}^{m} \gamma_{ij} X_j}{\sum_{j=1}^{m} \gamma_{ij}} μi=∑j=1mγij∑j=1mγijXj
- 新协方差矩阵 Σ i \Sigma_i Σi 的更新: Σ i = ∑ j = 1 m γ i j ( X j − μ i ) ( X j − μ i ) T ∑ j = 1 m γ i j \Sigma_i = \frac{\sum_{j=1}^{m} \gamma_{ij} (X_j - \mu_i)(X_j - \mu_i)^T}{\sum_{j=1}^{m} \gamma_{ij}} Σi=∑j=1mγij∑j=1mγij(Xj−μi)(Xj−μi)T
- 新混合系数 π i \pi_i πi 的更新: π i = 1 m ∑ j = 1 m γ i j \pi_i = \frac{1}{m} \sum_{j=1}^{m} \gamma_{ij} πi=m1∑j=1mγij
- Expectation (E) 步骤:
-
停止条件:
根据设定的停止条件,比如达到最大迭代轮数或模型参数的变化小于某一阈值。 -
簇划分:
根据得到的后验概率 γ i j \gamma_{ij} γij 确定每个样本的簇标记,将样本划入概率最大的簇中。C i = { X j ∣ argmax i γ i j , 1 ≤ i ≤ k } C_i = \{X_j | \text{argmax}_i \gamma_{ij}, 1 \leq i \leq k\} Ci={Xj∣argmaxiγij,1≤i≤k}
-
输出:
返回最终的簇划分 C = { C 1 , C 2 , . . . , C k } C = \{C_1, C_2, ..., C_k\} C={C1,C2,...,Ck}。
高斯混合聚类采用了迭代优化的方式,通过不断更新均值向量、协方差矩阵和混合系数,使得模型对数据的拟合更好。EM算法的E步骤计算后验概率,M步骤更新模型参数,整个过程不断迭代直至满足停止条件。最后,将每个样本划分到概率最大的簇中。
2. 算法解释
- 通过EM算法的E步骤,计算每个样本属于每个混合成分的后验概率。
- 通过EM算法的M步骤,更新每个混合成分的均值向量、协方差矩阵和混合系数,优化模型对数据的拟合。
- 算法通过迭代过程,不断调整模型参数,使得混合分布更好地刻画数据的分布。
3. 算法特点
- 通过多个高斯分布的组合,适用于不同形状的聚类结构。
- 采用EM算法进行迭代优化,灵活适应数据的复杂分布。
4. 应用场景
- 适用于数据具有多个分布的情况,且每个分布可以用高斯分布来描述。
- 在图像分割、语音识别等领域广泛应用。
5. 注意事项
- 初始参数的选择可能影响最终聚类效果,因此需要进行多次运行选择最优结果。
- 算法对异常值不敏感,但在特定场景下可能需要考虑异常值的处理。
二、实验环境
1. 配置虚拟环境
conda create -n ML python==3.9
conda activate ML
conda install scikit-learn matplotlib
2. 库版本介绍
| 软件包 | 本实验版本 |
|---|---|
| matplotlib | 3.5.2 |
| numpy | 1.21.5 |
| python | 3.9.13 |
| scikit-learn | 1.0.2 |
三、实验内容
0. 导入必要的库
import numpy as np
import matplotlib.pyplot as plt
from scipy.stats import multivariate_normal
from sklearn.datasets import load_iris
1. 全局调试变量
DEBUG = True
- 该变量控制是否在执行过程中打印调试信息。
2. 调试函数
def debug(*args, **kwargs):
    global DEBUG
    if DEBUG:
        print(*args, **kwargs)
- 用于打印调试信息的函数。在整个代码中都使用了它以进行调试。
3. 高斯密度函数(phi)
def phi(Y, mu_k, cov_k):
    # Check for and handle infinite or NaN values in Y
    norm = multivariate_normal(mean=mu_k, cov=cov_k)
    return norm.pdf(Y)
- 计算多元高斯分布的概率密度函数。
4. E步(getExpectation)
def getExpectation(Y, mu, cov, alpha):
    N = Y.shape[0]
    K = alpha.shape[0]

    assert N > 1, "There must be more than one sample!"
    assert K > 1, "There must be more than one gaussian model!"

    gamma = np.mat(np.zeros((N, K)))

    prob = np.zeros((N, K))
    for k in range(K):
        prob[:, k] = phi(Y, mu[k], cov[k]) * alpha[k]

    prob = np.mat(prob)

    for k in range(K):
        gamma[:, k] = prob[:, k] / np.sum(prob, axis=1)

    return gamma
- EM算法的E步骤,计算每个数据点属于每个簇的概率。主要步骤包括:
- 初始化一个零矩阵
gamma用于存储响应度。 - 对于每个簇,计算每个数据点属于该簇的概率(通过
phi函数计算),然后乘以该簇的混合系数。 - 归一化概率以得到响应度矩阵
gamma。
- 初始化一个零矩阵
5. M步(maximize)
def maximize(Y, gamma):
    N, D = Y.shape
    K = gamma.shape[1]

    mu = np.zeros((K, D))
    cov = []
    alpha = np.zeros(K)

    for k in range(K):
        Nk = np.sum(gamma[:, k])
        mu[k, :] = np.sum(np.multiply(Y, gamma[:, k]), axis=0) / Nk

        diff = Y - mu[k]
        cov_k = np.dot(diff.T, np.multiply(diff, gamma[:, k])) / Nk
        cov_k += 1e-6 * np.identity(D)  # Adding a small value to the diagonal for stability
        cov.append(cov_k)

        alpha[k] = Nk / N

    cov = np.array(cov)
    return mu, cov, alpha
- EM算法的M步骤,即更新模型参数,主要步骤包括:
- 初始化均值
mu、协方差矩阵列表cov和混合系数alpha。 - 对于每个簇,计算新的均值、协方差矩阵和混合系数。均值的更新是通过加权平均计算的,协方差矩阵的更新考虑了数据的权重(响应度),混合系数的更新是每个簇中数据点的权重之和。
- 初始化均值
6. 数据缩放函数
def scale_data(Y):
    for i in range(Y.shape[1]):
        max_ = Y[:, i].max()
        min_ = Y[:, i].min()
        Y[:, i] = (Y[:, i] - min_) / (max_ - min_)
    debug("Data scaled.")
    return Y
- 将数据集中的每个特征缩放到 [0, 1] 范围内。
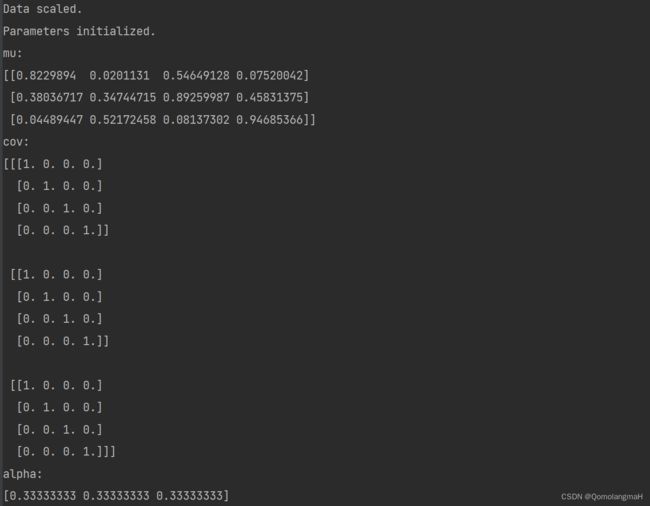
7. 初始化参数
def init_params(shape, K):
    N, D = shape
    mu = np.random.rand(K, D)
    cov = np.array([np.eye(D)] * K)
    alpha = np.array([1.0 / K] * K)
    debug("Parameters initialized.")
    debug("mu:", mu, "cov:", cov, "alpha:", alpha, sep="\n")
    return mu, cov, alpha
- 初始化GMM的参数(均值、协方差和混合系数)。
8. GMM EM算法函数
def GMM_EM(Y, K, times):
    Y = scale_data(Y)
    mu, cov, alpha = init_params(Y.shape, K)
    for i in range(times):
        gamma = getExpectation(Y, mu, cov, alpha)
        mu, cov, alpha = maximize(Y, gamma)
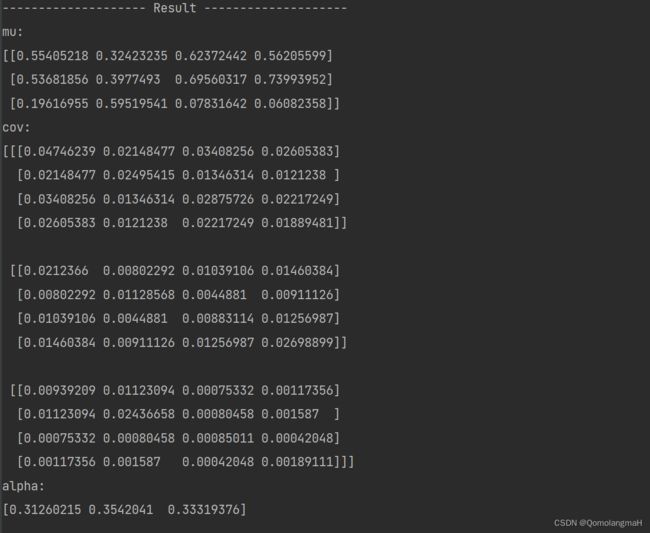
    debug("{sep} Result {sep}".format(sep="-" * 20))
    debug("mu:", mu, "cov:", cov, "alpha:", alpha, sep="\n")
    return mu, cov, alpha
9. 主函数
if __name__ == '__main__':
    # Load Iris dataset
    iris = load_iris()
    Y = iris.data

    # Model parameters
    K = 3  # number of clusters
    iterations = 100

    # Run GMM EM algorithm
    mu, cov, alpha = GMM_EM(Y, K, iterations)

    # Clustering based on the trained model
    N = Y.shape[0]
    gamma = getExpectation(Y, mu, cov, alpha)
    category = gamma.argmax(axis=1).flatten().tolist()[0]

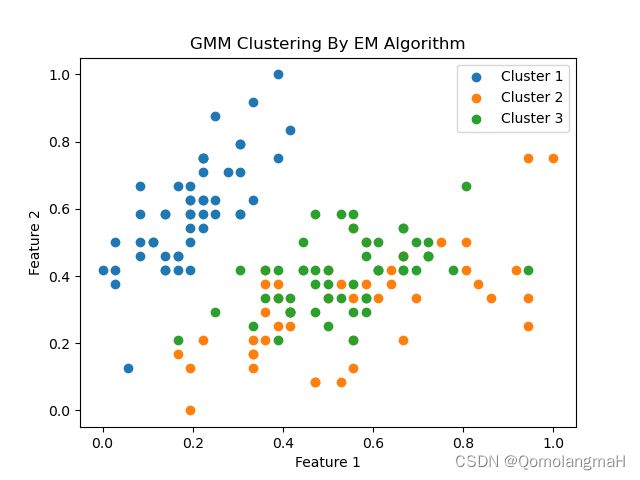
    # Plotting the results
    for i in range(K):
        cluster_data = np.array([Y[j] for j in range(N) if category[j] == i])
        plt.scatter(cluster_data[:, 0], cluster_data[:, 1], label=f'Cluster {i + 1}')

    plt.legend()
    plt.title("GMM Clustering By EM Algorithm")
    plt.xlabel("Feature 1")
    plt.ylabel("Feature 2")
    plt.show()
四、代码整合
import numpy as np
import matplotlib.pyplot as plt
from scipy.stats import multivariate_normal
from sklearn.datasets import load_iris

DEBUG = True


def debug(*args, **kwargs):
    global DEBUG
    if DEBUG:
        print(*args, **kwargs)


def phi(Y, mu_k, cov_k):
    # Check for and handle infinite or NaN values in Y
    norm = multivariate_normal(mean=mu_k, cov=cov_k)
    return norm.pdf(Y)


def getExpectation(Y, mu, cov, alpha):
    N = Y.shape[0]
    K = alpha.shape[0]

    assert N > 1, "There must be more than one sample!"
    assert K > 1, "There must be more than one gaussian model!"

    gamma = np.mat(np.zeros((N, K)))

    prob = np.zeros((N, K))
    for k in range(K):
        prob[:, k] = phi(Y, mu[k], cov[k]) * alpha[k]

    prob = np.mat(prob)

    for k in range(K):
        gamma[:, k] = prob[:, k] / np.sum(prob, axis=1)

    return gamma


def maximize(Y, gamma):
    N, D = Y.shape
    K = gamma.shape[1]

    mu = np.zeros((K, D))
    cov = []
    alpha = np.zeros(K)

    for k in range(K):
        Nk = np.sum(gamma[:, k])
        mu[k, :] = np.sum(np.multiply(Y, gamma[:, k]), axis=0) / Nk

        diff = Y - mu[k]
        cov_k = np.dot(diff.T, np.multiply(diff, gamma[:, k])) / Nk
        cov_k += 1e-6 * np.identity(D)  # Adding a small value to the diagonal for stability
        cov.append(cov_k)

        alpha[k] = Nk / N

    cov = np.array(cov)
    return mu, cov, alpha


def scale_data(Y):
    for i in range(Y.shape[1]):
        max_ = Y[:, i].max()
        min_ = Y[:, i].min()
        Y[:, i] = (Y[:, i] - min_) / (max_ - min_)
    debug("Data scaled.")
    return Y


def init_params(shape, K):
    N, D = shape
    mu = np.random.rand(K, D)
    cov = np.array([np.eye(D)] * K)
    alpha = np.array([1.0 / K] * K)
    debug("Parameters initialized.")
    debug("mu:", mu, "cov:", cov, "alpha:", alpha, sep="\n")
    return mu, cov, alpha


def GMM_EM(Y, K, times):
    Y = scale_data(Y)
    mu, cov, alpha = init_params(Y.shape, K)
    for i in range(times):
        gamma = getExpectation(Y, mu, cov, alpha)
        mu, cov, alpha = maximize(Y, gamma)
    debug("{sep} Result {sep}".format(sep="-" * 20))
    debug("mu:", mu, "cov:", cov, "alpha:", alpha, sep="\n")
    return mu, cov, alpha


if __name__ == '__main__':
    # Load Iris dataset
    iris = load_iris()
    Y = iris.data

    # Model parameters
    K = 3  # number of clusters
    iterations = 100

    # Run GMM EM algorithm
    mu, cov, alpha = GMM_EM(Y, K, iterations)

    # Clustering based on the trained model
    N = Y.shape[0]
    gamma = getExpectation(Y, mu, cov, alpha)
    category = gamma.argmax(axis=1).flatten().tolist()[0]

    # Plotting the results
    for i in range(K):
        cluster_data = np.array([Y[j] for j in range(N) if category[j] == i])
        plt.scatter(cluster_data[:, 0], cluster_data[:, 1], label=f'Cluster {i + 1}')

    plt.legend()
    plt.title("GMM Clustering By EM Algorithm")
    plt.xlabel("Feature 1")
    plt.ylabel("Feature 2")
    plt.show()


