Python--爬取天气网站天气数据并进行数据分析
目的:从天气网站中爬取数据,生成excel表格,里面存储南昌市近十一年的天气情况,并对爬取产生的数据进行数据分析。
第一步:编写代码进行数据爬取
首先,导入 requests 模块,并调用函数 requests.get(),从天气的网站上面获
取该函数所需要的各种参数,然后对里面的参数进行相应的赋值
其次,使用 pandas.concat().to_excel 函数,将爬取的结果保存到表格中,并
将其命名后保存到和代码文件相同的文件位置上
代码如下:
import pandas
import requests
url = 'https://tianqi.2345.com/Pc/GetHistory'
params = {'areaInfo[areaId]': 58606, 'areaInfo[areaType]': 2,
'date[year]': 2011,'date[month]': 1}
headers = {'user-agent': '''Mozilla/5.0 (Windows NT 10.0; Win64; x64)
AppleWebKit/537.36 (KHTML, like Gecko) Chrome/107.0.0.0 Safari/537.36
Edg/107.0.1418.62'''}
def craw_table(year,month):
params = {'areaInfo[areaId]': 58606, 'areaInfo[areaType]': 2,
'date[year]': year, 'date[month]': month}
pr = requests.get(url, headers=headers, params=params)
data = pr.json()['data']
df = pandas.read_html(data)[0]
return df
df_list=[]
for year in range(2011,2022):
for month in range(1,13):
print('爬取',year,month)
df = craw_table(year, month)
df_list.append(df)
#在py文件的文件夹中保存一个表格
pandas.concat(df_list).to_excel('南昌近十一年天气统计.xlsx',index=False)
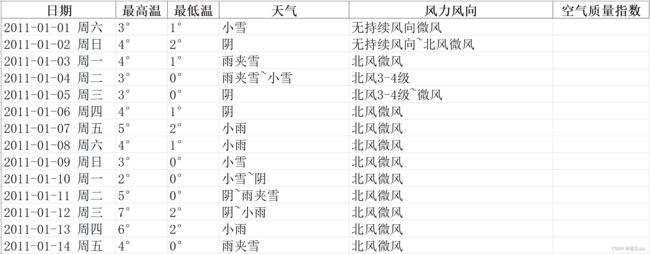
结果展示:生成表格
表格内部数据形式:
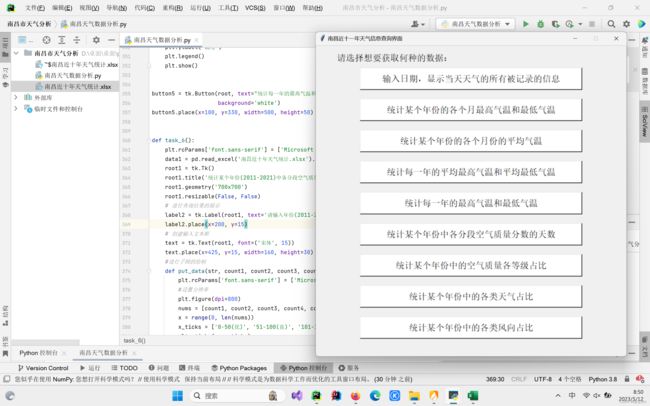
第二步:根据表格数据进行数据分析
代码展示:
import tkinter as tk
import pandas as pd
import numpy as np
import matplotlib.pyplot as plt
import warnings

warnings.filterwarnings('ignore')
#确保正确输出中文和负数
plt.rcParams['font.sans-serif'] = ['Microsoft YaHei']
# 使用tkinter模板
root = tk.Tk()
root.title('南昌近十一年天气信息查询界面')
root.geometry('700x700')
#禁止修改窗口的大小
root.resizable(False, False)
# 设置标签
label1 = tk.Label(root, text='请选择想要获取何种的数据:', font=('楷书', 15))
label1.place(x=45, y=15)


def task_1():
    # 跳转到一个新的内容显示界面
    root1 = tk.Tk()
    root1.title('特定时间的天气查询')
    root1.geometry('700x700')
    root1.resizable(False, False)
    # 进行查询结果的展示
    label2 = tk.Label(root1, text='请输入日期,以 - 分隔:', font=('楷书', 15), background='white')
    label2.place(x=45, y=15)
    # 创建输入文本框
    text = tk.Text(root1, font=('宋体', 15))
    text.place(x=300, y=15, width=160, height=30)

    # 设置几个小按钮,用来点击查询和清空内容
    # 设置查询函数
    def get_data():
        # 获取文本,并进行缺失值的填充
        data1 = (pd.read_excel('南昌近十年天气统计.xlsx')).fillna('该年份没有统计该数据')
        # 获取文本内容
        str = (text.get("0.0", "end"))[0:10]
        for i in range(0, 4005):
            if str == data1.loc[i, '日期'][0:10]:
                put_data(data1.loc[i])

    def put_data(data):
        # 输出文本内容
        label2 = tk.Label(root1, text='查询结果为:', font=('楷书', 15), background='white')
        label2.place(x=45, y=150)
        text1 = tk.Text(root1, font=('宋体', 15))
        text1.place(x=200, y=150, width=320, height=250)
        text1.insert(index=tk.END, chars='时间:' + data[0])
        text1.insert(index=tk.END, chars='\n\n最高温:' + data[1] + 'C')
        text1.insert(index=tk.END, chars='\n\n最低温:' + data[2] + 'C')
        text1.insert(index=tk.END, chars='\n\n天气:' + data[3])
        text1.insert(index=tk.END, chars='\n\n风力风向:' + data[4])
        text1.insert(index=tk.END, chars='\n\n空气质量指数:' + data[5])

    # 设置查询按钮
    button1 = tk.Button(root1, text="查询", command=get_data, font=('楷书', 15))
    button1.place(x=200, y=60, width=50, height=50)

    # 设置清空函数
    def delete_text():
        text.delete(0.0, tk.END)

    # 设置清空按钮
    button2 = tk.Button(root1, text="清空", command=delete_text, font=('楷书', 15))
    button2.place(x=330, y=60, width=50, height=50)
    # 设置退出按钮
    button3 = tk.Button(root1, text="退出", command=root1.destroy, font=('楷书', 15))
    button3.place(x=450, y=60, width=50, height=50)
    # 显示界面
    root1.mainloop()


button1 = tk.Button(root, text="输入日期,显示当天天气的所有被记录的信息", command=task_1, font=('楷书', 15),
                    background='white')
button1.place(x=100, y=50, width=500, height=50)


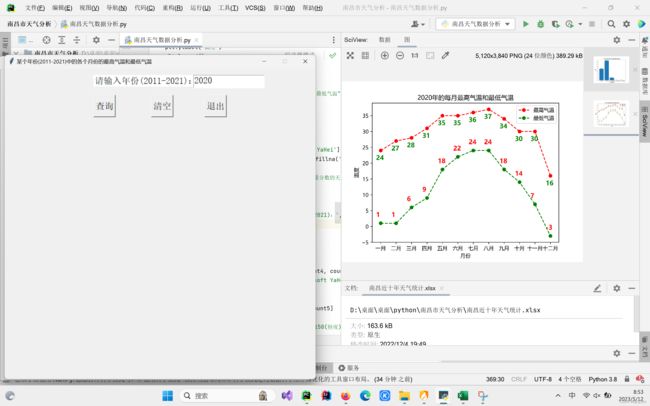
def task_2():
    plt.rcParams['font.sans-serif'] = ['Microsoft YaHei']
    data1 = pd.read_excel('南昌近十年天气统计.xlsx').fillna('该年份没有统计该数据')
    root1 = tk.Tk()
    root1.title('某个年份(2011-2021)中的各个月份的最高气温和最低气温')
    root1.geometry('700x700')
    root1.resizable(False, False)
    # 进行查询结果的展示
    label2 = tk.Label(root1, text='请输入年份(2011-2021):', font=('楷书', 15), background='white')
    label2.place(x=200, y=15)
    # 创建输入文本框
    text = tk.Text(root1, font=('宋体', 15))
    text.place(x=425, y=15, width=160, height=30)

    # 进行数据的处理
    def get_data():
        list1 = []
        list2 = []
        list_months = ['-01', '-02', '-03', '-04', '-05', '-06', '-07', '-08', '-09', '-10', '-11', '-12']
        # 寻找每一个月份的最高温度和最低温度
        for i in list_months:
            max = -100
            min = 200
            # 获取文本
            str = (text.get("0.0", "end"))[0:4] + i
            for j in range(0, 4005):
                if str in data1.loc[j, '日期']:
                    # 获取字符串中的温度,并转化为数字,进行比较
                    temp1 = int(data1.loc[j, '最高温'][0:len(data1.loc[j, '最高温']) - 1])
                    #更新最高温
                    if max < temp1:
                        max = temp1
                    # 获取字符串中的温度,并转化为数字,进行比较
                    temp2 = int(data1.loc[j, '最低温'][0:len(data1.loc[j, '最低温']) - 1])
                    #更新最低温
                    if min > temp2:
                        min = temp2
            #最高温统计记录
            list1.append(max)
            #最低温统计记录
            list2.append(min)
        # 进行子图的绘制
        x = np.array(
            ['一月', '二月', '三月', '四月', '五月', '六月', '七月', '八月', '九月', '十月', '十一月',
             '十二月'])
        x1 = [0,1,2,3,4,5,6,7,8,9,10,11]
        # 进行折线图的绘制
        # 设置分辨率
        plt.figure(dpi=800)
        # 线的颜色,线的样式,拐点的标志,标签
        plt.plot(x, list1, color='red', linestyle='--', marker='o', label='最高气温')
        plt.plot(x, list2, color='green', linestyle='--', marker='o', label='最低气温')
        #给每一个拐点都进行数据描述
        for i in range(0,len(x1)):
            plt.text(x = x1[i] - 0.3,y = list1[i] - 3,s = list1[i],
                      fontdict = dict(fontsize = 12,color = 'green'),weight = 'bold')
            plt.text(x = x1[i] - 0.3,y = list2[i] + 2,s = list2[i],
                      fontdict = dict(fontsize = 12,color = 'red'),weight = 'bold')
        # 展示图像
        plt.title((text.get("0.0", "end"))[0:4] + '年的每月最高气温和最低气温')
        plt.xlabel('月份')
        plt.ylabel('温度')
        plt.legend()
        plt.show()

    # 设置查询按钮
    button1 = tk.Button(root1, text="查询", command=get_data, font=('楷书', 15))
    button1.place(x=200, y=60, width=50, height=50)

    # 设置清空函数
    def delete_text():
        text.delete(0.0, tk.END)

    # 设置清空按钮
    button2 = tk.Button(root1, text="清空", command=delete_text, font=('楷书', 15))
    button2.place(x=330, y=60, width=50, height=50)
    # 设置退出按钮
    button3 = tk.Button(root1, text="退出", command=root1.destroy, font=('楷书', 15))
    button3.place(x=450, y=60, width=50, height=50)
    # 显示界面
    root1.mainloop()


button2 = tk.Button(root, text="统计某个年份的各个月最高气温和最低气温", command=task_2, font=('楷书', 15),
                    background='white')
button2.place(x=100, y=120, width=500, height=50)


def task_3():
    plt.rcParams['font.sans-serif'] = ['Microsoft YaHei']
    data1 = pd.read_excel('南昌近十年天气统计.xlsx').fillna('该年份没有统计该数据')
    root1 = tk.Tk()
    root1.title('某个年份中的各个月份的平均气温')
    root1.geometry('700x700')
    root1.resizable(False, False)
    # 进行查询结果的展示
    label2 = tk.Label(root1, text='请输入年份(2011-2021):', font=('楷书', 15), background='white')
    label2.place(x=200, y=15)
    # 创建输入文本框
    text = tk.Text(root1, font=('宋体', 15))
    text.place(x=425, y=15, width=160, height=30)

    # 进行数据的处理
    def get_data():
        list1 = []
        list2 = []
        list_months = ['-01', '-02', '-03', '-04', '-05', '-06', '-07', '-08', '-09', '-10', '-11', '-12']
        # 寻找每一个月份的最高温度和最低温度
        for i in list_months:
            # 获取文本
            str = (text.get("0.0", "end"))[0:4] + i
            for j in range(0, 4005):
                if str in data1.loc[j, '日期']:
                    # 获取字符串中的温度,并转化为数字,进行比较
                    temp1 = int(data1.loc[j, '最高温'][0:len(data1.loc[j, '最高温']) - 1])
                    temp2 = int(data1.loc[j, '最低温'][0:len(data1.loc[j, '最低温']) - 1])
                    # 保存每天的平均气温
                    list1.append((temp1 + temp2) // 2)
            # 计算并存储这一个月的平均气温
            list2.append(round(np.mean(list1),2))
        # 进行子图的绘制
        x = np.array(
            ['一月', '二月', '三月', '四月', '五月', '六月', '七月', '八月', '九月', '十月', '十一月',
             '十二月'])
        y = np.array(list2)
        # 进行折线图的绘制
        # 设置分辨率
        plt.figure(dpi=800)
        # 线的颜色,线的样式,拐点的标志,标签
        plt.yticks([i for i in range(6,25,2)])
        plt.ylim(4,24)
        plt.plot(x, y, color='red', linestyle='--', marker='s', label='每个月平均气温')
        #给每一个拐点都进行数据描述
        x1 = [0,1,2,3,4,5,6,7,8,9,10,11]
        for i in range(0,len(x)):
            plt.text(x = x1[i] - 0.7,y = list2[i] - 1.5,s = list2[i],
                      fontdict = dict(fontsize = 12,color = 'green'),weight = 'bold')
        # 展示图像
        plt.title((text.get("0.0", "end"))[0:4] + '年的每月平均气温')
        plt.xlabel('月份')
        plt.ylabel('温度')
        plt.legend()
        plt.show()

    # 设置查询按钮
    button1 = tk.Button(root1, text="查询", command=get_data, font=('楷书', 15))
    button1.place(x=200, y=60, width=50, height=50)

    # 设置清空函数
    def delete_text():
        text.delete(0.0, tk.END)

    # 设置清空按钮
    button2 = tk.Button(root1, text="清空", command=delete_text, font=('楷书', 15))
    button2.place(x=330, y=60, width=50, height=50)
    # 设置退出按钮
    button3 = tk.Button(root1, text="退出", command=root1.destroy, font=('楷书', 15))
    button3.place(x=450, y=60, width=50, height=50)
    # 显示界面
    root1.mainloop()


button3 = tk.Button(root, text="统计某个年份的各个月份的平均气温", command=task_3, font=('楷书', 15),
                    background='white')
button3.place(x=100, y=190, width=500, height=50)


def task_4():
    # 进行数据的读取
    data1 = (pd.read_excel('南昌近十年天气统计.xlsx')).fillna('该年份没有统计该数据')
    # 创建列表,用于存储数据
    list1 = [0, 354, 719, 1084, 1448, 1813, 2179, 2554, 2909, 3274, 3640, 4005]
    list2 = []
    list3 = []
    list4 = []
    list5 = []
    list6 = ['2011', '2012', '2013', '2014', '2015', '2016', '2017', '2018', '2019', '2020', '2021']
    for i in range(0, len(list1) - 1):
        for j in range(list1[i], list1[i + 1]):
            # 存储高温数据和低温数据
            list2.append(int(data1.loc[j, '最高温'][0:len(data1.loc[j, '最高温']) - 1]))
            list3.append(int(data1.loc[j, '最低温'][0:len(data1.loc[j, '最低温']) - 1]))
        # 存储两个平均值数据
        list4.append(np.mean(list2))
        list5.append(np.mean(list3))
        list2.clear()
        list3.clear()
    x = np.array(list6)
    y1 = np.array(list4)
    y2 = np.array(list5)
    # 进行折线图的绘制
    # 设置分辨率
    plt.figure(dpi=800)
    # 线的颜色,线的样式,拐点的标志,标签
    plt.plot(x, y1, color='red', linestyle='--', marker='s', label='平均最高气温')
    plt.plot(x, y2, color='green', linestyle='--', marker='s', label='平均最低气温')
    #给每一个拐点都进行数据描述
    y1 = y1.tolist()
    y2 = y2.tolist()
    x1 = [0,1,2,3,4,5,6,7,8,9,10]
    for i in range(0,len(x1)):
        plt.text(x = x1[i] - 0.3,y = y1[i] - 0.8,s = round(y1[i],1),
                    fontdict = dict(fontsize = 12,color = 'green'),weight = 'bold')
        plt.text(x = x1[i] - 0.3,y = y2[i] + 0.3,s = round(y2[i],1),
                    fontdict = dict(fontsize = 12,color = 'red'),weight = 'bold')
    # 展示图像
    plt.title('每一年的平均最高气温和平均最低气温')
    plt.xlabel('年份')
    plt.ylabel('温度')
    plt.legend()
    plt.show()


button4 = tk.Button(root, text="统计每一年的平均最高气温和平均最低气温", command=task_4, font=('楷书', 15),
                    background='white')
button4.place(x=100, y=260, width=500, height=50)


def task_5():
    data1 = pd.read_excel('南昌近十年天气统计.xlsx').fillna('暂无数据')
    # 创建数组保存数据,用于作图
    list3 = []
    list4 = []
    list5 = []

    # 统计每一年的最高温,最低温
    def get_temp(a, b, target):
        max = 0
        min = 0
        for i in range(a, b):
            # 最高温判断
            temp = data1.loc[i, '最高温']
            temp = int(temp[0:len(temp) - 1])
            if max < temp:
                max = temp
            # 最低温判断
            temp1 = data1.loc[i, '最低温']
            temp1 = int(temp1[0:len(temp1) - 1])
            if min > temp1:
                min = temp1
        list1 = ['2011', '2012', '2013', '2014', '2015', '2016', '2017', '2018', '2019', '2020', '2021']
        # 保存数据
        list3.append(list1[target])
        list4.append(max)
        list5.append(min)

    list1 = [0, 354, 719, 1084, 1448, 1813, 2179, 2554, 2909, 3274, 3640, 4005]
    for i in range(0, len(list1) - 1):
        get_temp(list1[i], list1[i + 1], i)
    # 进行子图的绘制
    # 设置分辨率
    plt.figure(dpi=800)
    x = np.array(list3)
    y1 = np.array(list4)
    y2 = np.array(list5)
    # 进行折线图的绘制
    # 线的颜色,线的样式,拐点的标志,标签
    plt.plot(x, y1, color='red', linestyle='--', marker='s', label='最高气温')
    plt.plot(x, y2, color='green', linestyle='--', marker='s', label='最低气温')
    plt.ylim(-10,50)
    x1 = [0,1,2,3,4,5,6,7,8,9,10]
    for i in range(0,len(x1)):
        plt.text(x = x1[i],y = y1[i] + 0.7,s = y1[i],
                    fontdict = dict(fontsize = 12,color = 'green'),weight = 'bold')
        plt.text(x = x1[i],y = y2[i] + 0.7,s = y2[i],
                    fontdict = dict(fontsize = 12,color = 'red'),weight = 'bold')
    # 展示图像
    plt.title('每一年的最高气温和最低气温')
    plt.xlabel('年份')
    plt.ylabel('温度')
    plt.legend()
    plt.show()


button5 = tk.Button(root, text="统计每一年的最高气温和最低气温", command=task_5, font=('楷书', 15),
                    background='white')
button5.place(x=100, y=330, width=500, height=50)


def task_6():
    plt.rcParams['font.sans-serif'] = ['Microsoft YaHei']
    data1 = pd.read_excel('南昌近十年天气统计.xlsx').fillna('该年份没有统计该数据')
    root1 = tk.Tk()
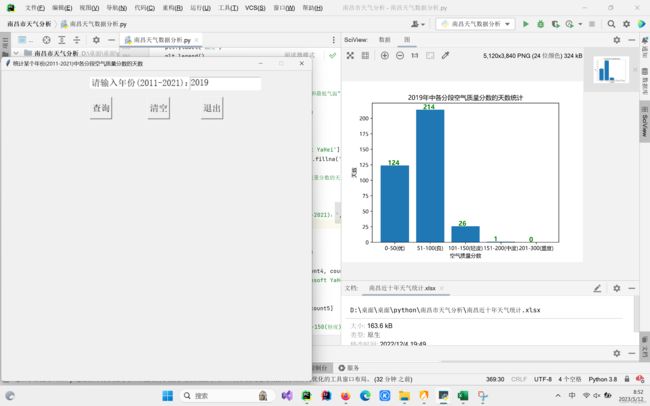
    root1.title('统计某个年份(2011-2021)中各分段空气质量分数的天数')
    root1.geometry('700x700')
    root1.resizable(False, False)
    # 进行查询结果的展示
    label2 = tk.Label(root1, text='请输入年份(2011-2021):', font=('楷书', 15), background='white')
    label2.place(x=200, y=15)
    # 创建输入文本框
    text = tk.Text(root1, font=('宋体', 15))
    text.place(x=425, y=15, width=160, height=30)
    #进行子图的绘制
    def put_data(str, count1, count2, count3, count4, count5):
        plt.rcParams['font.sans-serif'] = ['Microsoft YaHei']
        #设置分辨率
        plt.figure(dpi=800)
        nums = [count1, count2, count3, count4, count5]
        x = range(0, len(nums))
        x_ticks = ['0-50(优)', '51-100(良)', '101-150(轻度)', '151-200(中度)', '201-300(重度)']
        plt.xticks(x, x_ticks)
        plt.bar(x, nums)
        x1 = [0,1,2,3,4]
        for i in range(0,len(x1)):
            plt.text(x = x1[i] - 0.2,y = nums[i] + 0.7,s = nums[i],
                    fontdict = dict(fontsize = 12,color = 'green'),weight = 'bold')
        plt.xlabel('空气质量分数')
        plt.ylabel('天数')
        plt.title(str + '年中各分段空气质量分数的天数统计')
        plt.show()

    # 获取年份
    def get_data():
        str = (text.get("0.0", "end"))[0:4]
        count1 = count2 = count3 = count4 = count5 = 0
        # 判断年份
        for i in range(0, 4005):
            # 判断分数范围
            if str in data1.loc[i, '日期']:
                if len(data1.loc[i, '空气质量指数']) > 5:
                    if 101 <= int(data1.loc[i, '空气质量指数'][0:3]) <= 150:
                        count3 += 1
                    if 151 <= int(data1.loc[i, '空气质量指数'][0:3]) <= 200:
                        count4 += 1
                    if 201 <= int(data1.loc[i, '空气质量指数'][0:3]) <= 300:
                        count5 += 1
                elif 0 <= int(data1.loc[i, '空气质量指数'][0:3]) <= 50:
                    count1 += 1
                else:
                    count2 += 1
        put_data(str, count1, count2, count3, count4, count5)

    # 设置查询按钮
    button1 = tk.Button(root1, text="查询", command=get_data, font=('楷书', 15))
    button1.place(x=200, y=60, width=50, height=50)

    # 设置清空函数
    def delete_text():
        text.delete(0.0, tk.END)

    # 设置清空按钮
    button2 = tk.Button(root1, text="清空", command=delete_text, font=('楷书', 15))
    button2.place(x=330, y=60, width=50, height=50)
    # 设置退出按钮
    button3 = tk.Button(root1, text="退出", command=root1.destroy, font=('楷书', 15))
    button3.place(x=450, y=60, width=50, height=50)
    # 显示界面
    root1.mainloop()


button6 = tk.Button(root, text="统计某个年份中各分段空气质量分数的天数", command=task_6, font=('楷书', 15),
                    background='white')
button6.place(x=100, y=400, width=500, height=50)


def task_7():
    plt.rcParams['font.sans-serif'] = ['Microsoft YaHei']
    data1 = pd.read_excel('南昌近十年天气统计.xlsx').fillna('该年份没有统计该数据')
    root1 = tk.Tk()
    root1.title('某一个年份的空气质量各类等级占比')
    root1.geometry('700x700')
    root1.resizable(False, False)
    # 进行查询结果的展示
    label2 = tk.Label(root1, text='请输入年份(2011-2021):', font=('楷书', 15), background='white')
    label2.place(x=200, y=15)
    # 创建输入文本框
    text = tk.Text(root1, font=('宋体', 15))
    text.place(x=425, y=15, width=160, height=30)
    # 显示数据结果
    def put_data(str, count1, count2, count3, count4, count5):
        # 判断天数是否零
        if count1 == 0:
            count4 = 1
        if count2 == 0:
            count2 = 1
        plt.rcParams['font.sans-serif'] = ['Microsoft YaHei']
        # 设置分辨率
        plt.figure(dpi=800)
        labels = ['中度', '优', '良', '重度', '轻度']
        hours = [count2, count5, count4, count3, count1]
        colors = ['c', 'm', 'r', 'green', 'y']
        plt.pie(x=hours, labels=labels, colors=colors, shadow=False, autopct='%.1f%%',
                explode=(0.1, 0, 0, 0.2, 0.2),
                labeldistance=1.0, radius=1.2)
        plt.title(str + '年空气质量各类等级占比')
        plt.show()

    # 获取年份
    def get_data():
        str = (text.get("0.0", "end"))[0:4]
        count1 = count2 = count3 = count4 = count5 = 0
        for i in range(0, 4005):
            if str in data1.loc[i, '日期']:
                if '轻度' in data1.loc[i, '空气质量指数']:
                    count1 += 1
                elif '中度' in data1.loc[i, '空气质量指数']:
                    count2 += 1
                elif '重度' in data1.loc[i, '空气质量指数']:
                    count3 += 1
                elif '良' in data1.loc[i, '空气质量指数']:
                    count4 += 1
                elif '优' in data1.loc[i, '空气质量指数']:
                    count5 += 1
        put_data(str, count1, count2, count3, count4, count5)

    # 设置查询按钮
    button1 = tk.Button(root1, text="查询", command=get_data, font=('楷书', 15))
    button1.place(x=200, y=60, width=50, height=50)

    # 设置清空函数
    def delete_text():
        text.delete(0.0, tk.END)

    # 设置清空按钮
    button2 = tk.Button(root1, text="清空", command=delete_text, font=('楷书', 15))
    button2.place(x=330, y=60, width=50, height=50)
    # 设置退出按钮
    button3 = tk.Button(root1, text="退出", command=root1.destroy, font=('楷书', 15))
    button3.place(x=450, y=60, width=50, height=50)
    # 显示界面
    root1.mainloop()


button7 = tk.Button(root, text="统计某个年份中的空气质量各等级占比", command=task_7, font=('楷书', 15),
                    background='white')
button7.place(x=100, y=470, width=500, height=50)


def task_8():
    plt.rcParams['font.sans-serif'] = ['Microsoft YaHei']
    data1 = pd.read_excel('南昌近十年天气统计.xlsx').fillna('该年份没有统计该数据')
    root1 = tk.Tk()
    root1.title('某一个年份的各类天气占比')
    root1.geometry('700x700')
    root1.resizable(False, False)
    # 进行查询结果的展示
    label2 = tk.Label(root1, text='请输入年份(2011-2021):', font=('楷书', 15), background='white')
    label2.place(x=200, y=15)
    # 创建输入文本框
    text = tk.Text(root1, font=('宋体', 15))
    text.place(x=425, y=15, width=160, height=30)

    def put_data(str, count1, count2, count3, count4, count5):
        # 判断天数是否零
        if count1 == 0: count1 = 1
        if count2 == 0: count2 = 1
        plt.rcParams['font.sans-serif'] = ['Microsoft YaHei']
        # 设置分辨率
        plt.figure(dpi=800)
        labels = ['晴天', '多云', '雨天', '阴天', '雪天']
        hours = [count1, count2, count3, count4, count5]
        colors = ['c', 'm', 'r', 'green', 'y']
        plt.pie(x=hours, labels=labels, colors=colors, shadow=False, autopct='%.1f%%',
                explode=(0.1, 0.1, 0.1, 0.1, 0.1),
                labeldistance=1.2, radius=1.2)
        plt.title(str + '年空气质量各类等级占比')
        plt.show()

    # 获取年份
    def get_data():
        str = (text.get("0.0", "end"))[0:4]
        count1 = count2 = count3 = count4 = count5 = 0
        for i in range(0, 4005):
            if str in data1.loc[i, '日期']:
                if '晴' in data1.loc[i, '天气']:
                    count1 += 1
                if '多云' in data1.loc[i, '天气']:
                    count2 += 1
                if '雨' in data1.loc[i, '天气']:
                    count3 += 1
                if '阴' in data1.loc[i, '天气']:
                    count4 += 1
                if '雪' in data1.loc[i, '天气']:
                    count5 += 1
        put_data(str, count1, count2, count3, count4, count5)

    # 设置查询按钮
    button1 = tk.Button(root1, text="查询", command=get_data, font=('楷书', 15))
    button1.place(x=200, y=60, width=50, height=50)

    # 设置清空函数
    def delete_text():
        text.delete(0.0, tk.END)

    # 设置清空按钮
    button2 = tk.Button(root1, text="清空", command=delete_text, font=('楷书', 15))
    button2.place(x=330, y=60, width=50, height=50)
    # 设置退出按钮
    button3 = tk.Button(root1, text="退出", command=root1.destroy, font=('楷书', 15))
    button3.place(x=450, y=60, width=50, height=50)
    # 显示界面
    root1.mainloop()


button8 = tk.Button(root, text="统计某个年份中的各类天气占比", command=task_8, font=('楷书', 15),
                    background='white')
button8.place(x=100, y=540, width=500, height=50)


def task_9():
    plt.rcParams['font.sans-serif'] = ['Microsoft YaHei']
    data1 = pd.read_excel('南昌近十年天气统计.xlsx').fillna('该年份没有统计该数据')
    root1 = tk.Tk()
    root1.title('某一个年份的各类风向占比')
    root1.geometry('700x700')
    root1.resizable(False, False)
    # 进行查询结果的展示
    label2 = tk.Label(root1, text='请输入年份(2011-2021):', font=('楷书', 15), background='white')
    label2.place(x=200, y=15)
    # 创建输入文本框
    text = tk.Text(root1, font=('宋体', 15))
    text.place(x=425, y=15, width=160, height=30)

    # 输出数据
    def put_data(str, count1, count2, count3, count4, count5):
        # 判断天数是否零
        if count1 == 0:
            count1 = 1
        if count2 == 0:
            count2 = 1
        plt.rcParams['font.sans-serif'] = ['Microsoft YaHei']
        # 设置分辨率
        plt.figure(dpi=800)
        labels = ['东风', '西风', '南风', '北风', '无持续风向']
        hours = [count2, count3, count4, count5, count1]
        colors = ['c', 'm', 'r', 'green', 'y']
        plt.pie(x=hours, labels=labels, colors=colors, shadow=False, autopct='%.1f%%',
                explode=(0.1, 0.1, 0.1, 0.1, 0.1),
                labeldistance=1.2, radius=1.2)
        plt.title(str + '年空气质量各类等级占比')
        plt.show()

    # 获取年份
    def get_data():
        str1 = (text.get("0.0", "end"))[0:4]
        count1 = count2 = count3 = count4 = count5 = 0
        for i in range(0, 4005):
            if str1 in data1.loc[i, '日期']:
                if '无持续风向' in data1.loc[i, '风力风向']:
                    count1 += 1
                if '东' in data1.loc[i, '风力风向']:
                    count2 += 1
                if '西' in data1.loc[i, '风力风向']:
                    count3 += 1
                if '南' in data1.loc[i, '风力风向']:
                    count4 += 1
                if '北' in data1.loc[i, '风力风向']:
                    count5 += 1
        put_data(str1, count1, count2, count3, count4, count5)

    # 设置查询按钮
    button1 = tk.Button(root1, text="查询", command=get_data, font=('楷书', 15))
    button1.place(x=200, y=60, width=50, height=50)

    # 设置清空函数
    def delete_text():
        text.delete(0.0, tk.END)

    # 设置清空按钮
    button2 = tk.Button(root1, text="清空", command=delete_text, font=('楷书', 15))
    button2.place(x=330, y=60, width=50, height=50)
    # 设置退出按钮
    button3 = tk.Button(root1, text="退出", command=root1.destroy, font=('楷书', 15))
    button3.place(x=450, y=60, width=50, height=50)
    # 显示界面
    root1.mainloop()


button9 = tk.Button(root, text="统计某个年份中的各类风向占比", command=task_9, font=('楷书', 15),
                    background='white')
button9.place(x=100, y=610, width=500, height=50)

# 进行总菜单界面的展示
root.mainloop()
运行结果展示:
如果想保存生成的图片,可以自行添加代码进行保存
