R语言之简单图表制作1
比如简单画一个图
foo <- c(1.1,2,3.5,3.9,4.2)
bar<-c(2,2.2,-1.3,0,0.2)
plot(foo,bar)
运行结果:图表如下

还可以采用另外的方式输出刚才的图形
baz <- cbind(foo,bar)
baz
plot(baz)
 plot(foo,bar,type=“l”)
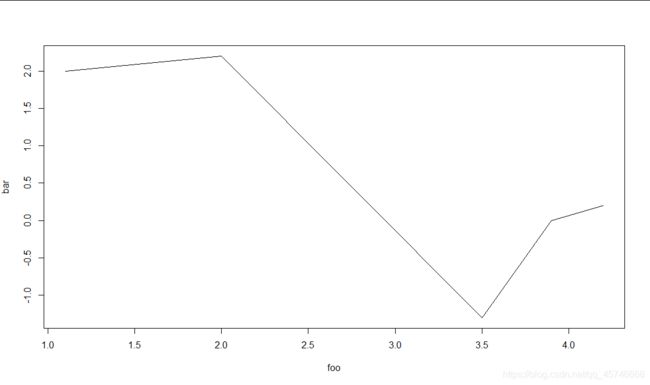
画带有标题和轴标签
plot(foo,bar,type="b",main="My lovely plot",xlab="x axis label",ylab="location y")
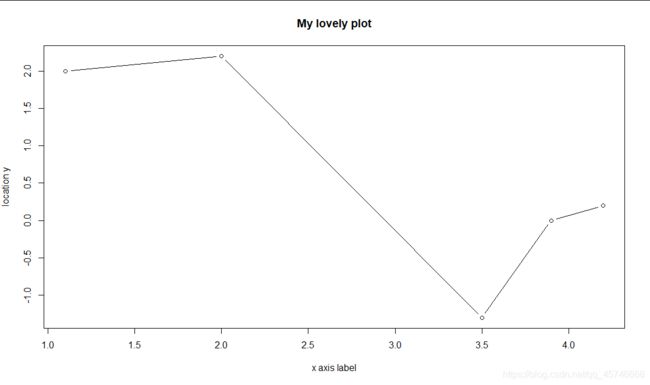
plot(foo,bar,type="b",main="My lovely plot\ntitle on two lines",xlab="",ylab="")

plot(foo,bar,type="b",main="My lovely plot",xlab="",ylab="",col=2)
plot(foo,bar,type="b",main="My lovely plot",xlab="",ylab="",col="seagreen4")
 改变一下线和点外观
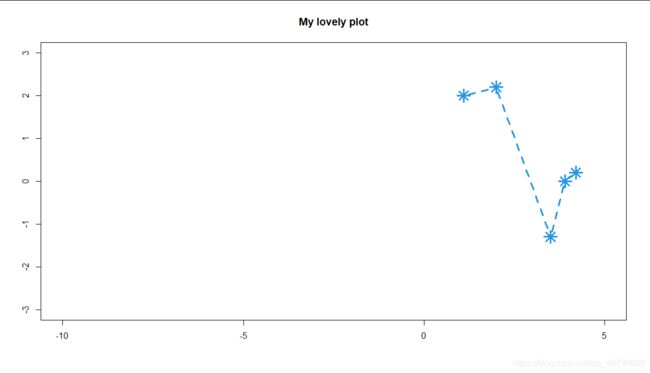
plot(foo,bar,type="b",main="My lovely plot",xlab="",ylab="", col=4,pch=8,lty=2,cex=2.3,lwd=3.3)

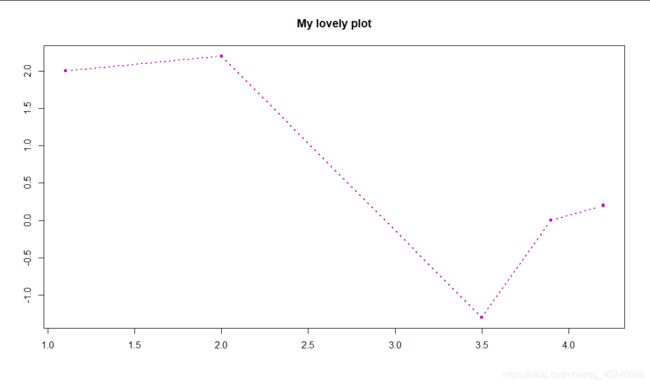
plot(foo,bar,type="b",main="My lovely plot",xlab="",ylab="", col=6,pch=15,lty=3,cex=0.7,lwd=2)
 画一些绘图区域限制的图
plot(foo,bar,type="b",main="My lovely plot",xlab="",ylab="",col=4,pch=8,lty=2,cex=2.3,lwd=3.3,xlim=c(-10,5),ylim=c(-3,3))
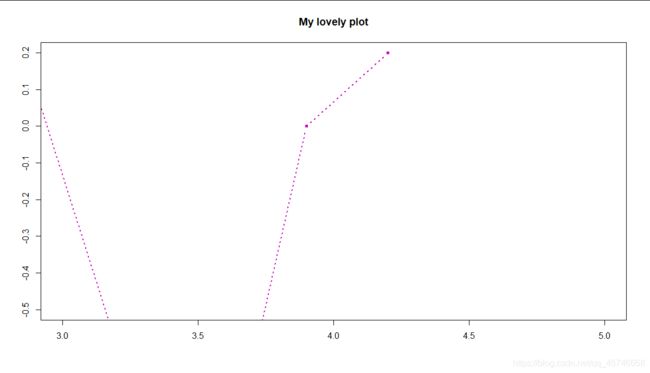
plot(foo,bar,type="b",main="My lovely plot",xlab="",ylab="",col=6,pch=15,lty=3,cex=0.7,lwd=2,xlim=c(3,5),ylim=c(-0.5,0.2))
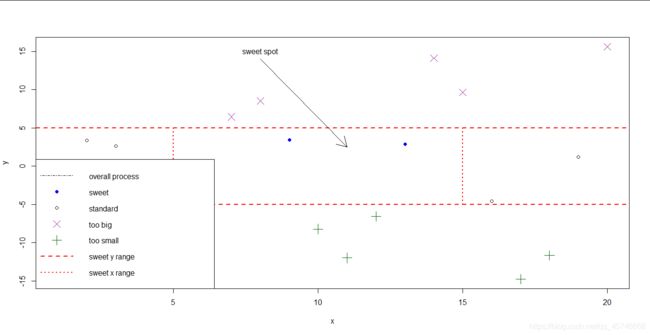
plot(x,y,type="n",main="")

abline(h=c(-5,5),col="red",lty=2,lwd=2)

segments(x0=c(5,15),y0=c(-5,-5),x1=c(5,15),y1=c(5,5),col="red",lty=3,lwd=2)

points(x[y>=5],y[y>=5],pch=4,col="darkmagenta",cex=2)

points(x[y<=-5],y[y<=-5],pch=3,col="darkgreen",cex=2)

points(x[(x>=5&x<=15)&(y>-5&y<5)],y[(x>=5&x<=15)&(y>-5&y<5)],pch=19, col="blue")

points(x[(x<5|x>15)&(y>-5&y<5)],y[(x<5|x>15)&(y>-5&y<5)])

lines(x,y,lty=4)

arrows(x0=8,y0=14,x1=11,y1=2.5)

legend("bottomleft",legend=c("overall process","sweet","standard", "too big","too small","sweet y range","sweet x range"),pch=c(NA,19,1,4,3,NA,NA),lty=c(4,NA,NA,NA,NA,2,3),col=c("black","blue","black","darkmagenta","darkgreen","red","red"),lwd=c(1,NA,NA,NA,NA,2,2),pt.cex=c(NA,1,1,2,2,NA,NA))
