leaflet将不同类型的marker添加到不同图层,并实现图层切换
leaflet在二维gis开发中使用比较广泛,本人最近也在从事gis相关开发。趁着这两天不是很忙,赶紧将这两天的开发过程记录一下,作为以后工作的参考。
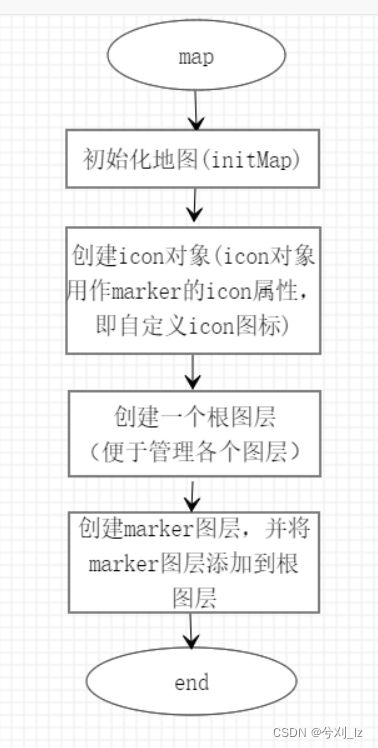
leaflet添加marker的一般步骤:
上图表现了leaflet添加marker的一般步骤。
初始化地图:
地图用的是超图的leaflet插件@supermap/iclient-leaflet,官方地址: https://github.com/SuperMap/iClient-JavaScript/tree/master/src/leaflet。选用超图的原因是后期画路径的时候可以很方便的调用超图的服务,另一方面是项目大框架基于超图。
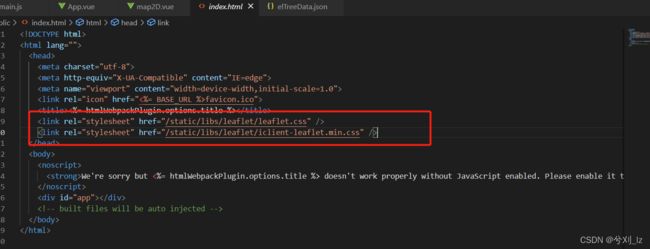
首先在项目中引入插件,如图:
本人为了方便将两个css下载到了本地,下载链接:https://unpkg.com/[email protected]/dist/leaflet.css,https://iclient.supermap.io/dist/leaflet/iclient-leaflet.min.css,这两个下载链接在官方都有,下载完成在html页面中引入即可。插件引入完成后进行地图的初始化,代码如下:
initMap () {
      const host = window.isLocal
        ? window.server
        : 'https://iserver.supermap.io'
      const url = host + '/iserver/services/map-china400/rest/maps/China'
      this.mapObj = L.map(this.mapId, {
        // center: [0, 0],
        center: [45.7413805110411, 127.165046475283],
        maxZoom: 18,
        zoom: 6,
        zoomControl: false
      })
      L.supermap.tiledMapLayer(url).addTo(this.mapObj)
      this.rootLayerGroup = L.featureGroup().addTo(this.mapObj) // 添加根图层(方便管理其他图层)
    },
然后再mounted中调用,如下:
mounted () {
    this.$nextTick(() => {
      this.initMap()
    })
  },
创建icon对象
在项目中,marker的种类不一,每种marker对应一个图标,因此需要的icon也就不一,加上marker点击高亮的icon,就需要为每个类型的mrker准备两个icon对象,一个默认,一个高亮,这里用两个对象defaultIcons和focusIcons分别保存默认图标和高亮图标(两个对象实际是两个map结构,以类型为key,对应的icon为value)。具体需要几种marker以后台数据为准,这里有一个json文件模拟数据:
{
    "code": 200,
    "data": [
        {
            "id": 1,
            "lat": "",
            "lng": "",
            "poiName": "桥梁",
            "poiType": "bridge",
            "children": [
                {
                    "id": 2,
                    "lat": 44.9255,
                    "lng": 127.2017,
                    "poiName": "佳木斯大桥",
                    "poiType": "bridge"
                },
                {
                    "id": 3,
                    "lat": 45.7933,
                    "lng": 128.6749,
                    "poiName": "佳木斯中桥",
                    "poiType": "bridge"
                },
                {
                    "id": 4,
                    "lat": 44.9194,
                    "lng": 128.5764,
                    "poiName": "佳木斯小桥",
                    "poiType": "bridge"
                },
                {
                    "id": 12,
                    "lat": 46.500976,
                    "lng": 125.049838,
                    "poiName": "桥A",
                    "poiType": "bridge"
                },
                {
                    "id": 13,
                    "lat": 46.11039,
                    "lng": 125.305188,
                    "poiName": "桥B",
                    "poiType": "bridge"
                },
                {
                    "id": 14,
                    "lat": 46.657439,
                    "lng": 125.026459,
                    "poiName": "桥C",
                    "poiType": "bridge"
                },
                {
                    "id": 15,
                    "lat": 47.744832,
                    "lng": 128.859247,
                    "poiName": "桥D",
                    "poiType": "bridge"
                },
                {
                    "id": 16,
                    "lat": 48.668639,
                    "lng": 130.477707,
                    "poiName": "桥E",
                    "poiType": "bridge"
                },
                {
                    "id": 17,
                    "lat": 47.424955,
                    "lng": 124.107461,
                    "poiName": "桥F",
                    "poiType": "bridge"
                },
                {
                    "id": 18,
                    "lat": 47.39034,
                    "lng": 123.920893,
                    "poiName": "桥G",
                    "poiType": "bridge"
                }
            ]
        },
        {
            "id": 5,
            "lat": "",
            "lng": "",
            "poiName": "涵洞",
            "poiType": "culvert",
            "children": [
                {
                    "id": 6,
                    "lat": 45.7404,
                    "lng": 127.1621,
                    "poiName": "涵洞1",
                    "poiType": "culvert"
                },
                {
                    "id": 7,
                    "lat": 45.44,
                    "lng": 126.41,
                    "poiName": "涵洞2",
                    "poiType": "culvert"
                },
                {
                    "id": 8,
                    "lat": 45.73832834,
                    "lng": 127.1584935,
                    "poiName": "涵洞3",
                    "poiType": "culvert"
                },
                {
                    "id": 19,
                    "lat": 44.599933,
                    "lng": 129.616987,
                    "poiName": "隧道A",
                    "poiType": "culvert"
                }
            ]
        },
        {
            "id": 9,
            "lat": "",
            "lng": "",
            "poiName": "标志",
            "poiType": "trafficSafe",
            "children": [
                {
                    "id": 10,
                    "lat": 45.74045209,
                    "lng": 127.1617092,
                    "poiName": "指示标志",
                    "poiType": "trafficSafe"
                },
                {
                    "poiName": "交通路牌",
                    "poiType": "trafficSafe",
                    "lat": 45.74045209,
                    "lng": 128.1617843,
                    "id": 11
                }
            ]
        }
    ]
}
可以看到这里的数据是一个树状结构,总共有3中marker(父节点的个数),为了方便将图片命名为对应的type,如图:
获取数据后初始化icon,代码如下:
async getData () {
      const dataRes = await axios.get('/static/json/elTreeData.json')
      if (dataRes) {
        const treeData = dataRes.data.data
        this.setIcons(treeData)
      }
    },
    /**
     * 初始化Icons
     */
    setIcons (data) {
      data.forEach((item) => {
        this.defaultIcons[item.poiType] = L.icon({
          iconUrl: '/static/images/' + item.poiType + 'DefaultIcon.png',
          iconSize: [48, 60],
          iconAnchor: [24, 60],
          popupAnchor: [0, -30]
        })
        this.focusIcons[item.poiType] = L.icon({
          iconUrl: '/static/images/' + item.poiType + 'FocusIcon.png',
          iconSize: [48, 60],
          iconAnchor: [24, 60],
          popupAnchor: [0, -30]
        })
      })
    },
创建marker图层以及marker点
创建marker的时候需要点聚合,点聚合使用的是leaflet的插件leaflet.markercluster,具体使用方法参照官方,官网地址https://github.com/Leaflet/Leaflet.markercluster,创建marker代码如下:
initMarkers (data) {
      data.forEach((item) => {
        // marker聚合 markerClusterGroup本质是一个图层,类似fetureGroup
        const markerLayer = L.markerClusterGroup({
          spiderfyOnMaxZoom: false,
          showCoverageOnHover: false,
          zoomToBoundsOnClick: false
        })
        item.children.forEach((item1) => {
          const marker = L.marker([item1.lat, item1.lng], {
            icon: this.defaultIcons[item1.poiType],
            markerId: item1.id,
            type: item1.poiType
          }).on('click', (ev) => {
            this.resetMarker()
            ev.target.setIcon(this.focusIcons[ev.target.options.type])
            this.focusMaker = ev.target
          })
          markerLayer.addLayer(marker)
        })
        this.rootLayerGroup.addLayer(markerLayer) // 将markerLayer添加到根图层
      })
    },
    /**
     * 将上一次点击marker的重置为默认图标
     */
    resetMarker () {
      if (this.focusMaker) {
        const iconType = this.focusMaker.options.type
        this.focusMaker.setIcon(this.defaultIcons[iconType])
      }
    }
添加图层切换功能
图层切换是利用了layerGroup的addLayer() 和 clearLayers()方法, 主要代码如下:
/**
     * 初始化checkbox值
     */
    initCheckGroup (data) {
      data.forEach((item) => {
        this.checkedMarkerLayerKey.push(item.poiType)
        this.markerLayerKeys.push({
          name: item.poiName,
          poiType: item.poiType
        })
      })
    },
    /**
     * 图层勾选
     */
    checkGroupChange (val) {
      this.rootLayerGroup.clearLayers()
      val.forEach((item) => {
        this.rootLayerGroup.addLayer(this.layersObj[item])
      })
    }
最终实现效果:
本篇文章作为本人实际项目的参考、复制、粘贴来源,因此有些细节并未提及。最后附上地图vue文件的完整代码。
mapVue完整代码
{{ item.name }}


