文章目录
- 柱状图-Tootip嵌套折线图
- 柱状图 - 多个
- 柱状图 - X轴Y轴标记线
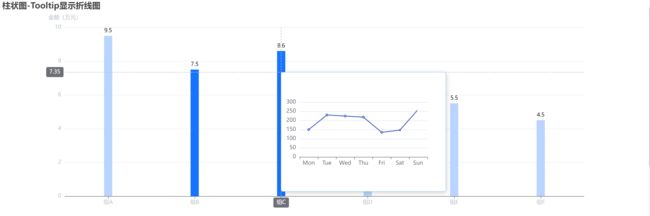
柱状图-Tootip嵌套折线图
let barChart = echarts.init(document.getElementById('bar_chart3'));
var xData = ['组A', '组B', '组C', '组D', '组E', '组F'];
var valueData = [9.5, 7.5, 8.6, 6.5, 5.5, 4.5];
var option = {
title: {
text: '柱状图-Tooltip显示折线图',
},
tooltip: {
appendToBody: true,
enterable: true,
padding: 5,
position: function(point, params, dom, rect, size) {
var html = '';
dom.innerHTML = html;
var myChart = echarts.init(dom.childNodes[0]);
var myOption = {
xAxis: {
type: 'category',
data: ['Mon', 'Tue', 'Wed', 'Thu', 'Fri', 'Sat', 'Sun'],
},
yAxis: {
type: 'value',
},
series: [
{
data: [150, 230, 224, 218, 135, 147, 260],
type: 'line',
},
],
};
myChart.setOption(myOption);
return point;
},
formatter: ' ',
},
axisPointer: { show: true },
xAxis: {
type: 'category',
data: xData,
axisTick: {
alignWithLabel: true,
color: '#C1C7D0',
},
axisLabel: {
color: '#C1C7D0',
},
},
yAxis: {
type: 'value',
name: '金额(万元)',
nameTextStyle: {
color: '#C1C7D0',
},
splitLine: {
lineStyle: {
type: 'dashed',
},
},
axisTick: { show: false },
axisLine: { show: false },
axisLabel: { color: '#C1C7D0' },
},
series: [
{
type: 'bar',
data: valueData,
barWidth: 18,
color: '#B9D5FF',
label: {
show: true,
position: 'top',
textStyle: {
color: 'black',
fontSize: 12,
},
},
emphasis: {
itemStyle: {
color: '#1874FF',
},
},
},
],
};
barChart.setOption(option);
barChart.on('mouseover', function(params) {
});
barChart.on('selectchanged', function(params) {
});
barChart.on('click', function(params) {
});
柱状图 - 多个

let barChart4 = echarts.init(this.$refs.bar_chart4);
var xData = ['组A', '组B', '组C', '组D', '组E', '组F'];
var moneyData = [8.0, 23.2, 25.6, 76.7, 135.6, 162.2];
var numData = [10, 28, 70, 20, 18, 48];
var option = {
tooltip: {
trigger: 'axis',
axisPointer: {
type: 'cross',
crossStyle: {
color: '#999',
},
},
},
legend: {
data: ['成交额', '成交量'],
bottom: '0',
itemWidth: 6,
itemHeight: 6,
},
xAxis: [
{
type: 'category',
data: xData,
axisPointer: {
type: 'shadow',
},
},
],
yAxis: [
{
type: 'value',
name: '金额:万元',
min: 0,
max: 250,
interval: 50,
axisLabel: {
formatter: '{value} 万元',
},
},
{
type: 'value',
name: '单位:数量',
min: 0,
max: 25,
interval: 5,
axisLabel: {
formatter: '{value} ',
},
},
],
series: [
{
name: '成交额',
type: 'bar',
barWidth: 20,
data: moneyData,
color: '#FBD444',
tooltip: {
valueFormatter: function(value) {
return value + ' 万元';
},
},
label: {
show: true,
position: 'top',
},
},
{
name: '成交量',
type: 'bar',
barWidth: 20,
data: numData,
color: '#53C8D1',
label: {
show: true,
position: 'top',
},
},
],
};
barChart4.setOption(option);
柱状图 - X轴Y轴标记线

let barChart = echarts.init(document.getElementById('bar_chart5'));
var option = {
  title: {
    text: '柱状图-X轴Y轴连续值',
  },
  xAxis: {
    type: 'value',
    name: 'x轴',
  },
  yAxis: {
    type: 'value',
    name: 'y轴',
  },
  series: [
    {
      data: [
        [1, 120],
        [2, 200],
        [3, 150],
        [4, 80],
        [5, 70],
        [6, 110],
        [7, 130],
      ],
      type: 'bar',
      barMaxWidth: 18,
      markLine: {
        silent: true,
        symbol: ['none', 'none'],
        lineStyle: {
          width: 2,
          type: 'dotted',
          color: '#5B8FF9',
        },
        data: [
          {
            name: 'y轴标记线',
            yAxis: 120,
            label: {
              position: 'insideStartTop',
            },
          },
          {
            name: 'x轴标记线',
            xAxis: 4.5,
          },
        ],
      },
    },
  ],
};
barChart.setOption(option);