echarts 折线图
记录echarts 折线图使用以及相关配置。
1.基本折线图

 mounted() {
    // 基础折线图
    const option = {
      xAxis: {
        type: 'category',
        data: ['Mon', 'Tue', 'Wed', 'Thu', 'Fri', 'Sat', 'Sun']
      },
      yAxis: {
        type:'value',
      },
      series: [
        {
          data: [150, 230, 224, 218, 135, 147, 260],
          type: 'line'
        }
      ]
    }
    myChart.setOption(option);
  },
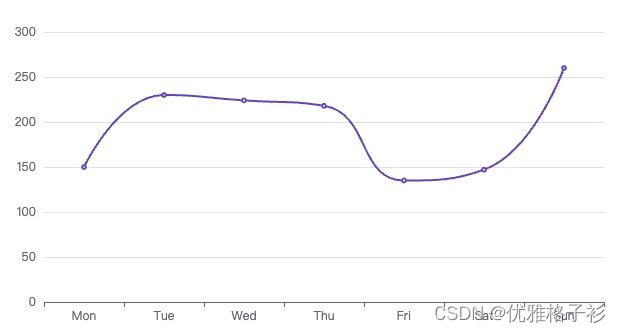
2.折线图平滑
 mounted() {
    // 基础折线图
    const option = {
      xAxis: {
        type: 'category',
        data: ['Mon', 'Tue', 'Wed', 'Thu', 'Fri', 'Sat', 'Sun']
      },
      yAxis: {
        type:'value',
      },
      series: [
        {
          data: [150, 230, 224, 218, 135, 147, 260],
          type: 'line',
          smooth: true,
        }
      ]
    }
    myChart.setOption(option);
  },
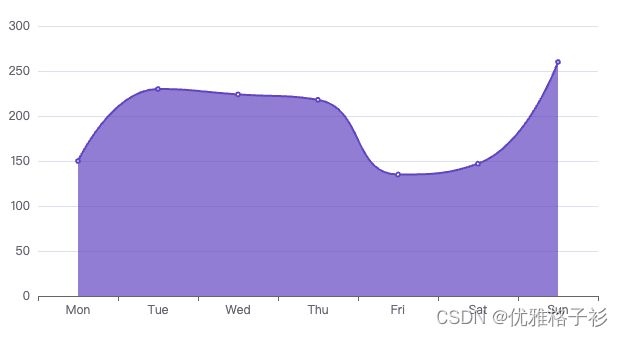
3.折线图阴影
 mounted() {
    // 基础折线图
    const option = {
      xAxis: {
        type: 'category',
        data: ['Mon', 'Tue', 'Wed', 'Thu', 'Fri', 'Sat', 'Sun']
      },
      yAxis: {
        type:'value',
      },
      series: [
        {
          data: [150, 230, 224, 218, 135, 147, 260],
          type: 'line',
          smooth: true,
          areaStyle: {}
        }
      ]
    }
    myChart.setOption(option);
  },
4.学习进度案例
增加标题副标题,图例组件,工具栏,y轴增加单位,提示框文本增加单位。

<template>
  <div>
    <div ref="echartsZx" class="echarts"> </div>
  </div>
</template>
<script>
import * as echarts from 'echarts';
export default {
  name: 'echartsZx',
  data() {
    return {
      dataTime: [
        {
          name: '语文',
          type: 'line',
          stack: 'Total',
          data: [12, 13, 10, 24, 90, 70, 60],
          // areaStyle: {} //阴影
        },
        {
          name: '数学',
          type: 'line',
          stack: 'Total',
          data: [30, 20, 10, 30, 90, 70, 80]
        },
        {
          name: '英语',
          type: 'line',
          stack: 'Total',
          data: [50, 32, 61, 74, 10, 100, 30]
        },
        {
          name: '历史',
          type: 'line',
          stack: 'Total',
          data: [40, 52, 70, 94, 9, 50, 80]
        },
        {
          name: '地理',
          type: 'line',
          stack: 'Total',
          data: [80, 93, 90, 34, 10, 13, 20]
        }
      ]
    }
  },
  mounted() {
    // 基于准备好的dom,初始化echarts实例
    const myChart = echarts.init(this.$refs.echartsZx);
    // 绘制图表
    const option = {
      //标题组件,包含主标题和副标题
      title: {
        text: '本周学习进度', //主标题
        textStyle: { //配置主标题颜色
          color: '#000'
        },
        subtext: '这里是副标题',//副标题
        subtextStyle:{//配置父标题颜色
          color:'red'
        }
      },
      //提示框
      tooltip: {
        //axis 坐标轴触发,主要在柱状图,折线图等会使用类目轴的图表中使用。
        trigger: 'axis',
        confine: true,
        //给提示框提示数据加单位
        formatter: (params) => {
          // console.log(params);
          var relVal = params[0].name
          for (var i = 0, l = params.length; i < l; i++) {
            relVal += '
' + params[i].seriesName + ' '+  params[i].marker + ' '+ params[i].value + ' %'
          }
          return relVal
        },
      },
      //图例组件
      legend: {
        type: 'scroll',
        data: this.dataTime.map(item => item.name)
      },
      //left,right,bottom定义组件的距离边距
      grid: {
        left: '2%',
        right: '2%',
        bottom: '3%',
        containLabel: true
      },
      //工具栏。内置有导出图片,数据视图,动态类型切换,数据区域缩放,重置五个工具
      toolbox: {
        feature: {
          magicType: {
            type: ['line', 'bar', 'stack']
          },
          saveAsImage: {},
          restore: {}
        }
      },
      //直角坐标系 grid 中的 x 轴
      xAxis: {
        type: 'category',
        boundaryGap: false,
        data: ['周一', '周二', '周三', '周四', '周五', '周六', '周日']
      },
      //直角坐标系 grid 中的 y 轴
      yAxis: {
        type: 'value',
        //y轴 增加单位
        axisLabel: {
          formatter: '{value} %'
        }
      },
      series: this.dataTime
    }
    myChart.setOption(option);
    window.addEventListener('resize', function () {
      myChart.resize()
    })
  },
  methods: {

  }
};
</script>
<style lang='scss' scoped>
.echarts {
  width: 700px;
  height: 400px;
  overflow: hidden;
  margin-top: 30px;
}
</style>