我在Vscode学OpenCV 图像处理四(轮廓查找 cv2.findContours() cv2.drawContours())-- 待补充
图像处理四(轮廓查找)
- 一、前言
-
- 1.1 边缘检测和轮廓查找的区别是什么
-
- 1.1.1 边缘检测:
- 1.1.2 轮廓查找:
- 1.2 边缘检测和轮廓查找在图像处理中的关系和流程
- 二、查找并绘制轮廓
-
- 2.1 cv2.findContours():
-
- 2.1.1 详细介绍:
- 2.1.2 注意事项:
- 2.2 cv2.drawContours():
-
- 2.2.1 详细介绍:
- 2.3 实际运用
- 2.4 标记记数,再说先前函数参数
-
- 2.4.1 分析代码的走向:
- 2.4.2 在给轮廓标注序号的过程中,使用了OpenCV的 `cv.putText()` 函数。这个函数用于在图像上绘制文本,具体的用法如下:
-
- (1)findContours函数的contours参数
- (2)findContours函数的hierarchy参数
- 2.4.3 分开显示
-
- 逐步解释:
一、前言
在OpenCV中,边缘检测和轮廓查找是两个不同的图像处理任务,它们有不同的目标和应用。
1.1 边缘检测和轮廓查找的区别是什么
1.1.1 边缘检测:
- 定义: 边缘检测是指寻找图像中灰度级别变化明显的地方,即图像中物体之间的界限。这些变化通常表示图像中的边缘或轮廓。
- 方法: 常用的边缘检测算法包括Sobel、Canny、Laplacian等。这些算法通过在图像中寻找灰度级别变化最大的地方来标记边缘。
import cv2

# 读取图像
image = cv2.imread('image.jpg', cv2.IMREAD_GRAYSCALE)

# 使用Canny边缘检测
edges = cv2.Canny(image, 100, 200)

# 显示边缘检测结果
cv2.imshow('Edges', edges)
cv2.waitKey(0)
cv2.destroyAllWindows()
1.1.2 轮廓查找:
- 定义: 轮廓是图像中连续的边界线,表示相同颜色或灰度的区域的边界。轮廓查找的目标是找到图像中对象的外形。
- 方法: OpenCV提供了
findContours函数来查找图像中的轮廓。这个函数返回轮廓的坐标点,然后可以通过绘制这些坐标点来可视化轮廓。
import cv2

# 读取图像
image = cv2.imread('image.jpg', cv2.IMREAD_GRAYSCALE)

# 使用Canny边缘检测
edges = cv2.Canny(image, 100, 200)

# 查找轮廓
contours, _ = cv2.findContours(edges, cv2.RETR_EXTERNAL, cv2.CHAIN_APPROX_SIMPLE)

# 在原图上绘制轮廓
cv2.drawContours(image, contours, -1, (0, 255, 0), 2)

# 显示结果
cv2.imshow('Contours', image)
cv2.waitKey(0)
cv2.destroyAllWindows()
总结:
边缘检测强调的是图像中灰度级别的变化,而轮廓查找强调的是图像中相邻区域的边界。在实际应用中,这两种技术通常可以结合使用,先进行边缘检测,然后通过轮廓查找来识别和分析图像中的对象。
1.2 边缘检测和轮廓查找在图像处理中的关系和流程
边缘检测用于发现图像中灰度变化明显的区域,但这些边缘通常是不连续的。为了构成完整的对象轮廓,需要将这些边缘连接在一起。
为了进行轮廓查找,首先需要将图像转换为二值图像,其中对象是白色,背景是黑色。这可以通过预先进行阈值分割或者边缘检测处理来实现。
轮廓查找通常会修改原始图像,因此为了保留原始图像的完整性,我们通常会在原始图像的一份拷贝上进行操作。
在OpenCV中,默认情况下假设对象是白色,背景是黑色。因此,在进行轮廓查找时,确保对象是白色,背景是黑色,以确保正确识别图像中的对象轮廓。
二、查找并绘制轮廓
cv2.findContours()
cv2.drawContours()
在OpenCV中,cv2.findContours() 是用于查找图像轮廓的函数,
而 cv2.drawContours() 则是用于将查找到的轮廓绘制到图像上的函数。
2.1 cv2.findContours():
- 这个函数用于在二值图像中查找对象的轮廓。
- 返回轮廓的坐标点列表和层次结构(hierarchy)信息。
import cv2

# 读取图像并转换为灰度图
image = cv2.imread('image.jpg')
gray = cv2.cvtColor(image, cv2.COLOR_BGR2GRAY)

# 进行阈值分割,得到二值图像
_, thresh = cv2.threshold(gray, 127, 255, cv2.THRESH_BINARY)

# 查找轮廓
contours, hierarchy = cv2.findContours(thresh, cv2.RETR_EXTERNAL, cv2.CHAIN_APPROX_SIMPLE)

# contours 包含了所有轮廓的坐标点
# hierarchy 包含了轮廓的层次结构信息
2.1.1 详细介绍:
cv2.findContours() 是 OpenCV 中用于查找图像轮廓的函数。它的基本用法如下:
image, contours, hierarchy = cv2.findContours(image, mode, method)
其中各参数的含义如下:
-
image: 输入的二值图像(通常是经过阈值处理的图像)。要确保输入图像是单通道的(灰度图像)且为二值图像,可以使用
cv2.cvtColor()和cv2.threshold()进行转换和阈值处理。 -
mode: 轮廓检索模式。指定轮廓的检索模式,有以下几个可选值:
cv2.RETR_EXTERNAL:只检索最外层的轮廓。cv2.RETR_LIST:检索所有的轮廓,并将其保存到列表中。cv2.RETR_CCOMP:检索所有轮廓,并将其组织为两层的层次结构(目前不常用)。
【建立两个等级的轮廓,上面的一层为外边界,里面的一层为内孔的边界信息。如果内孔内还有一个连通物体,这个物体的边界也在顶层。】
cv2.RETR_TREE:检索所有轮廓,并重构轮廓之间的完整层次结构。
建立一个等级树结构的轮廓。
-
method: 轮廓逼近方法。指定轮廓的逼近方法,有以下几个可选值
cv2.CHAIN_APPROX_NONE:保存所有的轮廓点。
存储所有的轮廓点,相邻的两个点的像素位置差不超过1,max (abs (x1-x2) , abs (y2-y1) ) ==1
cv2.CHAIN_APPROX_SIMPLE:压缩水平、垂直和对角方向,只保留端点。
只保留该方向的终点坐标,例如一个矩形轮廓只需4个点来保存轮廓信息[节约空间]
cv2.CHAIN_APPROX_NONE 存储的轮廓,保存
了轮廓中的每一个点;右图是使用参数值 cv2.CHAIN_APPROX_SIMPLE 存储的轮廓,仅仅保
存了边界上的四个点。

cv2.CHAIN_APPROX_TC89_L1:使用 Teh-Chin 链逼近算法。cv2.CHAIN_APPROX_TC89_KCOS:使用 Teh-Chin 链逼近算法。
函数返回三个值:
- image: 输入图像,通常不会改变。
- contours: 包含轮廓坐标的列表。每个轮廓由一系列坐标点表示。
- hierarchy: 轮廓的层次结构信息,用于表示轮廓之间的嵌套关系。
示例代码:
import cv2

# 读取图像并转换为灰度图
image = cv2.imread('image.jpg')
gray = cv2.cvtColor(image, cv2.COLOR_BGR2GRAY)

# 进行阈值分割,得到二值图像
_, thresh = cv2.threshold(gray, 127, 255, cv2.THRESH_BINARY)

# 查找轮廓
contours, hierarchy = cv2.findContours(thresh, cv2.RETR_EXTERNAL, cv2.CHAIN_APPROX_SIMPLE)

# contours 包含了所有轮廓的坐标点
# hierarchy 包含了轮廓的层次结构信息
这个函数在图像处理中常用于对象检测、形状分析等任务。
2.1.2 注意事项:
遇到的错误 “not enough values to unpack (expected 3, got 2)” 可能是因为在OpenCV 4.x中,cv.findContours 函数只返回两个值:轮廓(contours)和层次结构(hierarchy)。在你的代码中,你试图解包三个值 (img, contours, hierachy),这导致了错误
在OpenCV的3.x版本和4.x版本之间,主要的变化之一是cv2.findContours()函数的返回值。在3.x版本中,该函数返回三个值,而在4.x版本中,只返回两个值。下面是一个简要对比:
OpenCV 3.x:
# OpenCV 3.x
img, contours, hierarchy = cv2.findContours(image, mode, method)
img: 原始图像contours: 轮廓坐标的列表hierarchy: 轮廓的层次结构信息
OpenCV 4.x:
# OpenCV 4.x
contours, hierarchy = cv2.findContours(image, mode, method)
contours: 轮廓坐标的列表hierarchy: 轮廓的层次结构信息
如上所示,主要的变化是在4.x版本中去除了原始图像的返回,使得函数的返回结果更加简洁。如果你从3.x版本迁移到4.x版本,需要注意修改相关代码以适应新的函数返回形式。
2.2 cv2.drawContours():
- 这个函数用于将查找到的轮廓绘制到图像上。
- 可以选择绘制所有轮廓或者仅绘制特定的轮廓。
# 绘制所有轮廓
cv2.drawContours(image, contours, -1, (0, 255, 0), 2)

# 显示绘制轮廓后的图像
cv2.imshow('Contours', image)
cv2.waitKey(0)
cv2.destroyAllWindows()
这两个函数通常一起使用,cv2.findContours() 用于获取轮廓信息,然后 cv2.drawContours() 用于将轮廓绘制到图像上,以便进一步分析或可视化。
2.2.1 详细介绍:
cv2.drawContours() 是 OpenCV 中用于在图像上绘制轮廓的函数。它的基本用法如下:
result = cv2.drawContours(image, contours, contourIdx, color, thickness)
其中各参数的含义如下:
-
image: 要绘制轮廓的图像。
-
contours: 包含轮廓坐标的列表,通常是由
cv2.findContours()函数返回的轮廓。 -
contourIdx: 要绘制的轮廓在
contours列表中的索引。如果为负数(默认值为 -1),则绘制所有的轮廓。 -
color: 绘制轮廓的颜色,通常是一个包含三个整数值的元组,表示BGR颜色。
-
thickness: 绘制轮廓的线条厚度。如果为负数,表示填充轮廓。
函数返回一个新的图像,包含了绘制了轮廓的结果。
示例代码:
import cv2
import numpy as np

# 创建一张空白图像
image = np.zeros((300, 300, 3), dtype=np.uint8)

# 创建一个包含轮廓坐标的列表
contours = np.array([[[50, 50]], [[150, 50]], [[100, 150]]], dtype=np.int32)

# 绘制轮廓
result = cv2.drawContours(image, [contours], -1, (0, 255, 0), 2)

# 显示绘制轮廓后的图像
cv2.imshow('Contours', result)
cv2.waitKey(0)
cv2.destroyAllWindows()
这个函数在图像处理中用于可视化检测到的轮廓,使得我们能够直观地观察到图像中对象的形状和边界。
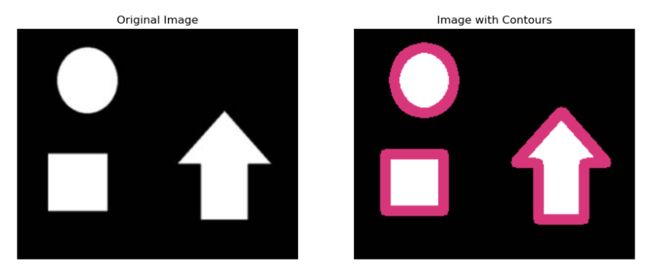
2.3 实际运用
import cv2 as cv
import matplotlib.pyplot as plt

# 读取图像
image = cv.imread('img8/ss.jpg')

# 转换为灰度图
gray_image = cv.cvtColor(image, cv.COLOR_BGR2GRAY)

# 阈值处理得到二值图像
ret, binary = cv.threshold(gray_image, 127, 255, cv.THRESH_BINARY)

# 寻找轮廓
contours, hierarchy = cv.findContours(binary, cv.RETR_TREE, cv.CHAIN_APPROX_NONE)

# 在原始图像的副本上绘制轮廓
image_with_contours = image.copy()
cv.drawContours(image_with_contours, contours, -1, (122, 55, 215), 10)

# 使用 matplotlib 显示原图和带有轮廓的图像
plt.figure(figsize=(12, 6))

# 显示原图
plt.subplot(1, 2, 1)
plt.title('Original Image')
plt.imshow(cv.cvtColor(image, cv.COLOR_BGR2RGB))
plt.axis('off')

# 显示带有轮廓的图像
plt.subplot(1, 2, 2)
plt.title('Image with Contours')
plt.imshow(cv.cvtColor(image_with_contours, cv.COLOR_BGR2RGB))
plt.axis('off')

plt.show()
2.4 标记记数,再说先前函数参数
import cv2 as cv
import matplotlib.pyplot as plt

image = cv.imread('img8/ss.jpg')
gray_image = cv.cvtColor(image, cv.COLOR_BGR2GRAY)

ret, binary = cv.threshold(gray_image, 127, 255, cv.THRESH_BINARY)

# 寻找轮廓
contours, hierarchy = cv.findContours(binary, cv.RETR_TREE, cv.CHAIN_APPROX_SIMPLE)

# 在原始图像的副本上绘制轮廓并标注序号
image_with_contours = image.copy()
for i, contour in enumerate(contours):
    cv.drawContours(image_with_contours, [contour], -1, (122, 55, 215), 2)
    # 标注轮廓序号
    cv.putText(image_with_contours, str(i+1), tuple(contour[0][0]), cv.FONT_HERSHEY_SIMPLEX, 0.5, (0, 255, 0), 2)

# 使用 matplotlib 显示结果
plt.subplot(121), plt.imshow(cv.cvtColor(image, cv.COLOR_BGR2RGB)), plt.title('Original Image')
plt.subplot(122), plt.imshow(cv.cvtColor(image_with_contours, cv.COLOR_BGR2RGB)), plt.title('Image with Contours')
plt.show()
2.4.1 分析代码的走向:
-
cv.imread('img8/ss.jpg'): 从文件中读取一张图像(文件路径为'img8/ss.jpg')。 -
cv.cvtColor(image, cv.COLOR_BGR2GRAY): 将彩色图像转换为灰度图像。 -
cv.threshold(gray_image, 127, 255, cv.THRESH_BINARY): 对灰度图像进行阈值处理,得到二值图像。 -
cv.findContours(binary, cv.RETR_TREE, cv.CHAIN_APPROX_SIMPLE): 寻找二值图像中的轮廓,并返回轮廓的坐标和层次结构。 -
image_with_contours = image.copy(): 复制原始图像,用于在其上绘制轮廓。 -
for i, contour in enumerate(contours):: 对于每个轮廓,使用enumerate获取轮廓的索引和轮廓本身。a.
cv.drawContours(image_with_contours, [contour], -1, (122, 55, 215), 2): 在图像副本上绘制轮廓,颜色为(122, 55, 215),线条粗细为2。b.
cv.putText(image_with_contours, str(i+1), tuple(contour[0][0]), cv.FONT_HERSHEY_SIMPLEX, 0.5, (0, 255, 0), 2): 标注轮廓序号,以文本形式显示在图像上,颜色为(0, 255, 0)(绿色),字体大小为0.5,线条粗细为2。 -
plt.subplot(121), plt.imshow(cv.cvtColor(image, cv.COLOR_BGR2RGB)), plt.title('Original Image'): 创建Matplotlib子图,显示原始图像。 -
plt.subplot(122), plt.imshow(cv.cvtColor(image_with_contours, cv.COLOR_BGR2RGB)), plt.title('Image with Contours'): 创建Matplotlib子图,显示带有轮廓的图像。 -
plt.show(): 显示Matplotlib绘制的原始图像和带有轮廓的图像。
总体而言,这段代码的目的是可视化图像处理中的轮廓查找过程,通过标注轮廓序号,使用户能够更清晰地理解图像中检测到的对象的形状和位置。
2.4.2 在给轮廓标注序号的过程中,使用了OpenCV的 cv.putText() 函数。这个函数用于在图像上绘制文本,具体的用法如下:
cv.putText(img, text, org, fontFace, fontScale, color, thickness, lineType, bottomLeftOrigin)
各参数含义如下:
img: 需要绘制文本的图像。text: 要绘制的文本内容。org: 文本的起始坐标,即文本左下角的坐标。fontFace: 字体类型,例如cv.FONT_HERSHEY_SIMPLEX。fontScale: 字体缩放因子。color: 文本的颜色。thickness: 文本线条的粗细。lineType: 线条类型。bottomLeftOrigin: 如果为真,文本起始坐标将被认为是左下角;如果为假(默认),则为左上角。
在给轮廓标注序号的代码中,这个函数的具体应用如下:
# 标注轮廓序号
cv.putText(image_with_contours, str(i+1), tuple(contour[0][0]), cv.FONT_HERSHEY_SIMPLEX, 0.5, (255, 0, 0), 2)
这一行代码的作用是将轮廓的序号以文本的形式标注在原始图像的副本上。str(i+1) 将轮廓的索引加1转换为字符串,tuple(contour[0][0]) 是轮廓的第一个点的坐标,cv.FONT_HERSHEY_SIMPLEX 是字体类型,0.5 是字体缩放因子,(255, 0, 0) 是文本颜色(蓝色),2 是文本线条的粗细。这样,每个轮廓的序号就被标注在了图像上。
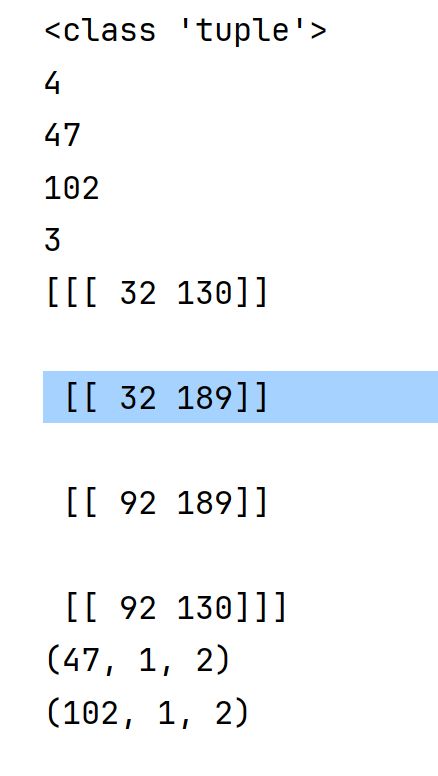
(1)findContours函数的contours参数
这个呢,是标记的时候字段+1了,所以和下标错位1的
print (type(contours))
print (len(contours[0]))
print (len(contours[1]))
print (len(contours[2]))
print (len(contours))

print (contours[0])
print(contours[1].shape)
print(contours[2].shape)
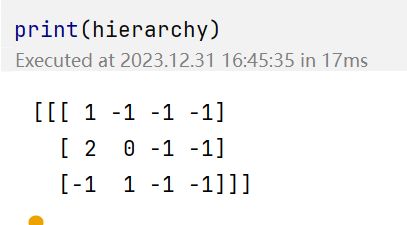
(2)findContours函数的hierarchy参数
[Next,Previous,First_Child,Parent]
Next:后一个轮廓的索引编号。
Previous:前一个轮廓的索引编号。
First_Child:第 1 个子轮廓的索引编号。
Parent:父轮廓的索引编号。
如果上述各个参数所对应的关系为空时,也就是没有对应的关系时,则将该参数所对应的
值设为“-1”。
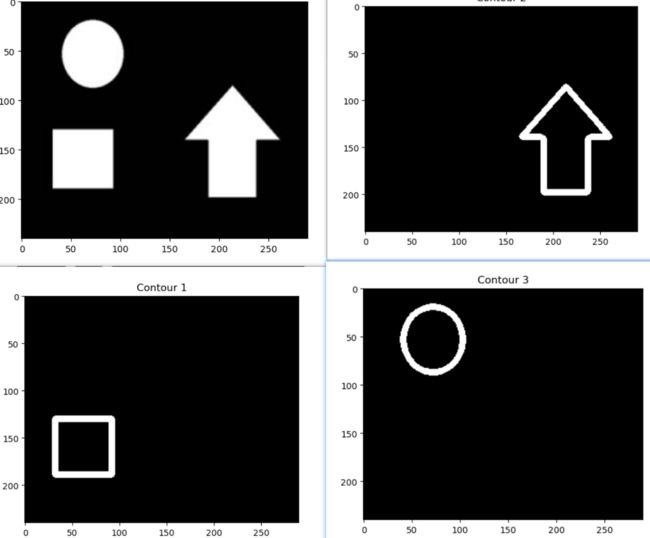
2.4.3 分开显示
import cv2
import numpy as np
import matplotlib.pyplot as plt

o = cv2.imread('img8/ss.jpg')
plt.imshow(cv2.cvtColor(o, cv2.COLOR_BGR2RGB))
plt.title('Original Image')
plt.show()

gray = cv2.cvtColor(o, cv2.COLOR_BGR2GRAY)
ret, binary = cv2.threshold(gray, 127, 255, cv2.THRESH_BINARY)
contours, hierarchy = cv2.findContours(binary, cv2.RETR_EXTERNAL, cv2.CHAIN_APPROX_SIMPLE)

n = len(contours)
contoursImg = []

for i in range(n):
    temp = np.zeros(o.shape, np.uint8)
    contoursImg.append(temp)
    contoursImg[i] = cv2.drawContours(contoursImg[i], contours, i, (255, 255, 255), 5)

    # Display each contour using plt
    plt.imshow(cv2.cvtColor(contoursImg[i], cv2.COLOR_BGR2RGB))
    plt.title(f'Contour {i + 1}')
    plt.show()
逐步解释:
以下是对上述代码每一步的分析:
-
读取原始图像:
o = cv2.imread('contours.bmp') plt.imshow(cv2.cvtColor(o, cv2.COLOR_BGR2RGB)) plt.title('Original Image') plt.show()- 使用 OpenCV 读取名为 ‘contours.bmp’ 的图像。
- 将图像转换为 RGB 格式,并使用 Matplotlib 显示原始图像。
-
灰度转换和二值化:
gray = cv2.cvtColor(o, cv2.COLOR_BGR2GRAY) ret, binary = cv2.threshold(gray, 127, 255, cv2.THRESH_BINARY)- 将原始图像转换为灰度图。
- 对灰度图进行二值化处理。
-
查找轮廓:
image, contours, hierarchy = cv2.findContours(binary, cv2.RETR_EXTERNAL, cv2.CHAIN_APPROX_SIMPLE)- 使用
cv2.findContours()函数查找二值图像中的轮廓。 cv2.RETR_EXTERNAL参数表示只检测外部轮廓。cv2.CHAIN_APPROX_SIMPLE参数表示使用简化的轮廓表示。
- 使用
-
绘制并显示每个轮廓:
n = len(contours) contoursImg = [] for i in range(n): temp = np.zeros(o.shape, np.uint8) contoursImg.append(temp) contoursImg[i] = cv2.drawContours(contoursImg[i], contours, i, (255, 255, 255), 5) # Display each contour using plt plt.imshow(cv2.cvtColor(contoursImg[i], cv2.COLOR_BGR2RGB)) plt.title(f'Contour {i + 1}') plt.show()- 遍历所有检测到的轮廓,每个轮廓都被绘制在
contoursImg的相应元素中。 - 使用 Matplotlib 显示每个绘制了轮廓的图像,标题显示轮廓的序号。
- 遍历所有检测到的轮廓,每个轮廓都被绘制在
总体而言,这段代码的目的是在原始图像中找到轮廓,然后将每个轮廓在图像上绘制出来并使用 Matplotlib 逐个显示,以便用户更好地理解轮廓检测的结果。
