高维数据可视化示例
高维数据可视化示例
文中代码均在Jupyter Notebook中运行
文中所需两个数据文件在下面给出。
文中数据集下载1
文中数据集下载2
目录
- 高维数据可视化示例
- 单变量分析
- 多变量分析
-
- 可视化二维数据
- 可视化三维数据
- 可视化四维数据
- 可视化 5 维数据
- 可视化 6 维数据(6-D)
- 结论
import pandas as pd
import matplotlib.pyplot as plt
from mpl_toolkits.mplot3d import Axes3D
import matplotlib as mpl
import numpy as np
import seaborn as sns
%matplotlib inline
white_wine = pd.read_csv("C:/Users/lenovo/Desktop/winequality-white.csv",sep=';')
red_wine = pd.read_csv("C:/Users/lenovo/Desktop/winequality-red.csv",sep=';')
red_wine
| fixed acidity | volatile acidity | citric acid | residual sugar | chlorides | free sulfur dioxide | total sulfur dioxide | density | pH | sulphates | alcohol | quality | |
|---|---|---|---|---|---|---|---|---|---|---|---|---|
| 0 | 7.4 | 0.700 | 0.00 | 1.9 | 0.076 | 11.0 | 34.0 | 0.99780 | 3.51 | 0.56 | 9.4 | 5 |
| 1 | 7.8 | 0.880 | 0.00 | 2.6 | 0.098 | 25.0 | 67.0 | 0.99680 | 3.20 | 0.68 | 9.8 | 5 |
| 2 | 7.8 | 0.760 | 0.04 | 2.3 | 0.092 | 15.0 | 54.0 | 0.99700 | 3.26 | 0.65 | 9.8 | 5 |
| 3 | 11.2 | 0.280 | 0.56 | 1.9 | 0.075 | 17.0 | 60.0 | 0.99800 | 3.16 | 0.58 | 9.8 | 6 |
| 4 | 7.4 | 0.700 | 0.00 | 1.9 | 0.076 | 11.0 | 34.0 | 0.99780 | 3.51 | 0.56 | 9.4 | 5 |
| ... | ... | ... | ... | ... | ... | ... | ... | ... | ... | ... | ... | ... |
| 1594 | 6.2 | 0.600 | 0.08 | 2.0 | 0.090 | 32.0 | 44.0 | 0.99490 | 3.45 | 0.58 | 10.5 | 5 |
| 1595 | 5.9 | 0.550 | 0.10 | 2.2 | 0.062 | 39.0 | 51.0 | 0.99512 | 3.52 | 0.76 | 11.2 | 6 |
| 1596 | 6.3 | 0.510 | 0.13 | 2.3 | 0.076 | 29.0 | 40.0 | 0.99574 | 3.42 | 0.75 | 11.0 | 6 |
| 1597 | 5.9 | 0.645 | 0.12 | 2.0 | 0.075 | 32.0 | 44.0 | 0.99547 | 3.57 | 0.71 | 10.2 | 5 |
| 1598 | 6.0 | 0.310 | 0.47 | 3.6 | 0.067 | 18.0 | 42.0 | 0.99549 | 3.39 | 0.66 | 11.0 | 6 |
1599 rows × 12 columns
#为两个表分别添加新的列标签,作为酒的类型
red_wine["wine_type"]="red"
white_wine['wine_type']="white"
#将数据标签数值改为文字性描述,增加了一个列标签quality_label进行描述
red_wine["quality_label"]=red_wine["quality"].apply(lambda value:"low"
                                                       if value<=5 else "medium"
                                                           if value <=7 else "high")
red_wine["quality_label"]=pd.Categorical(red_wine["quality_label"],categories=["low","medium","high"])

white_wine["quality_label"]=white_wine["quality"].apply(lambda value:"low"
                                                       if value<=5 else "medium"
                                                           if value <=7 else "high")
white_wine["quality_label"]=pd.Categorical(white_wine["quality_label"],categories=["low","medium","high"])
#将两个表进行上下合并
wines=pd.concat([red_wine,white_wine])
wines
| fixed acidity | volatile acidity | citric acid | residual sugar | chlorides | free sulfur dioxide | total sulfur dioxide | density | pH | sulphates | alcohol | quality | wine_type | quality_label | |
|---|---|---|---|---|---|---|---|---|---|---|---|---|---|---|
| 0 | 7.4 | 0.70 | 0.00 | 1.9 | 0.076 | 11.0 | 34.0 | 0.99780 | 3.51 | 0.56 | 9.4 | 5 | red | low |
| 1 | 7.8 | 0.88 | 0.00 | 2.6 | 0.098 | 25.0 | 67.0 | 0.99680 | 3.20 | 0.68 | 9.8 | 5 | red | low |
| 2 | 7.8 | 0.76 | 0.04 | 2.3 | 0.092 | 15.0 | 54.0 | 0.99700 | 3.26 | 0.65 | 9.8 | 5 | red | low |
| 3 | 11.2 | 0.28 | 0.56 | 1.9 | 0.075 | 17.0 | 60.0 | 0.99800 | 3.16 | 0.58 | 9.8 | 6 | red | medium |
| 4 | 7.4 | 0.70 | 0.00 | 1.9 | 0.076 | 11.0 | 34.0 | 0.99780 | 3.51 | 0.56 | 9.4 | 5 | red | low |
| ... | ... | ... | ... | ... | ... | ... | ... | ... | ... | ... | ... | ... | ... | ... |
| 4893 | 6.2 | 0.21 | 0.29 | 1.6 | 0.039 | 24.0 | 92.0 | 0.99114 | 3.27 | 0.50 | 11.2 | 6 | white | medium |
| 4894 | 6.6 | 0.32 | 0.36 | 8.0 | 0.047 | 57.0 | 168.0 | 0.99490 | 3.15 | 0.46 | 9.6 | 5 | white | low |
| 4895 | 6.5 | 0.24 | 0.19 | 1.2 | 0.041 | 30.0 | 111.0 | 0.99254 | 2.99 | 0.46 | 9.4 | 6 | white | medium |
| 4896 | 5.5 | 0.29 | 0.30 | 1.1 | 0.022 | 20.0 | 110.0 | 0.98869 | 3.34 | 0.38 | 12.8 | 7 | white | medium |
| 4897 | 6.0 | 0.21 | 0.38 | 0.8 | 0.020 | 22.0 | 98.0 | 0.98941 | 3.26 | 0.32 | 11.8 | 6 | white | medium |
6497 rows × 14 columns
#打乱顺序,增加随机性
wines = wines.sample(frac=1,random_state=42).reset_index(drop=True)
wines.head()
| fixed acidity | volatile acidity | citric acid | residual sugar | chlorides | free sulfur dioxide | total sulfur dioxide | density | pH | sulphates | alcohol | quality | wine_type | quality_label | |
|---|---|---|---|---|---|---|---|---|---|---|---|---|---|---|
| 0 | 7.0 | 0.17 | 0.74 | 12.8 | 0.045 | 24.0 | 126.0 | 0.99420 | 3.26 | 0.38 | 12.2 | 8 | white | high |
| 1 | 7.7 | 0.64 | 0.21 | 2.2 | 0.077 | 32.0 | 133.0 | 0.99560 | 3.27 | 0.45 | 9.9 | 5 | red | low |
| 2 | 6.8 | 0.39 | 0.34 | 7.4 | 0.020 | 38.0 | 133.0 | 0.99212 | 3.18 | 0.44 | 12.0 | 7 | white | medium |
| 3 | 6.3 | 0.28 | 0.47 | 11.2 | 0.040 | 61.0 | 183.0 | 0.99592 | 3.12 | 0.51 | 9.5 | 6 | white | medium |
| 4 | 7.4 | 0.35 | 0.20 | 13.9 | 0.054 | 63.0 | 229.0 | 0.99888 | 3.11 | 0.50 | 8.9 | 6 | white | medium |
#输出两种酒的统计数据指标
subset_attributes = ["residual sugar","total sulfur dioxide","sulphates","alcohol","volatile acidity","quality"]

rs=round(red_wine[subset_attributes].describe(),2)
ws=round(white_wine[subset_attributes].describe(),2)

pd.concat([rs,ws],axis=1,keys=["Red Wine Statistics","White Wine Statistics"])#横向合并
| Red Wine Statistics | White Wine Statistics | |||||||||||
|---|---|---|---|---|---|---|---|---|---|---|---|---|
| residual sugar | total sulfur dioxide | sulphates | alcohol | volatile acidity | quality | residual sugar | total sulfur dioxide | sulphates | alcohol | volatile acidity | quality | |
| count | 1599.00 | 1599.00 | 1599.00 | 1599.00 | 1599.00 | 1599.00 | 4898.00 | 4898.00 | 4898.00 | 4898.00 | 4898.00 | 4898.00 |
| mean | 2.54 | 46.47 | 0.66 | 10.42 | 0.53 | 5.64 | 6.39 | 138.36 | 0.49 | 10.51 | 0.28 | 5.88 |
| std | 1.41 | 32.90 | 0.17 | 1.07 | 0.18 | 0.81 | 5.07 | 42.50 | 0.11 | 1.23 | 0.10 | 0.89 |
| min | 0.90 | 6.00 | 0.33 | 8.40 | 0.12 | 3.00 | 0.60 | 9.00 | 0.22 | 8.00 | 0.08 | 3.00 |
| 25% | 1.90 | 22.00 | 0.55 | 9.50 | 0.39 | 5.00 | 1.70 | 108.00 | 0.41 | 9.50 | 0.21 | 5.00 |
| 50% | 2.20 | 38.00 | 0.62 | 10.20 | 0.52 | 6.00 | 5.20 | 134.00 | 0.47 | 10.40 | 0.26 | 6.00 |
| 75% | 2.60 | 62.00 | 0.73 | 11.10 | 0.64 | 6.00 | 9.90 | 167.00 | 0.55 | 11.40 | 0.32 | 6.00 |
| max | 15.50 | 289.00 | 2.00 | 14.90 | 1.58 | 8.00 | 65.80 | 440.00 | 1.08 | 14.20 | 1.10 | 9.00 |
单变量分析
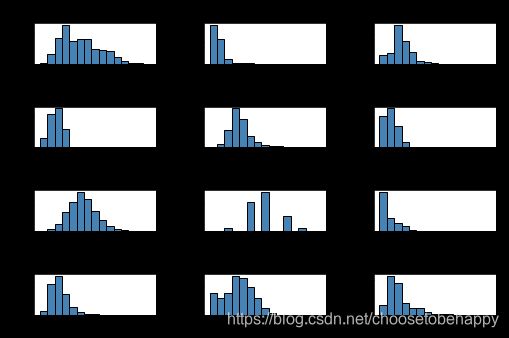
单变量分析基本上是数据分析或可视化的最简单形式,因为只关心分析一个数据属性或变量并将其可视化
wines.hist(bins=15,color="steelblue",edgecolor="black",linewidth=1.0,xlabelsize=8,ylabelsize=8,grid=False)
plt.tight_layout(rect=(0,0,1.2,1.2))#调整各子图之间的间距
fig=plt.figure(figsize=(6,4))
title=fig.suptitle("Sulphates Content in Wine",fontsize=14)
fig.subplots_adjust(top=0.85,wspace=0.3)#调整间距

ax=fig.add_subplot(1,1,1)
ax.set_xlabel("Sulphates")
ax.set_ylabel("Frequency")
ax.text(1.2,800,r"$\mu$="+str(round(wines['sulphates'].mean(),2)),fontsize=12)#在途图中的指定位置
freq,bins,patches=ax.hist(wines["sulphates"],color="steelblue",bins=15,edgecolor="black",linewidth=1)#做出关于sulphates的直方图

fig=plt.figure(figsize=(6,4))
title = fig.suptitle("Sulphates Content in Wine",fontsize=14)
fig.subplots_adjust(top=0.85,wspace=0.3)#调整间距

ax1=fig.add_subplot(1,1,1)
ax1.set_xlabel("Sulphates")
ax1.set_ylabel("Frequency")
sns.kdeplot(wines["sulphates"],ax=ax1,shade=True,color="steelblue")#做出核密度图
可视化一个离散分类型数据属性稍有不同,条形图是(bar plot)最有效的方法之一。你也可以使用饼图(pie-chart),但一般来说要尽量避免,尤其是当不同类别的数量超过 3 个时
多变量分析
多元分析才是真正有意思并且有复杂性的领域。这里我们分析多个数据维度或属性(2 个或更多)。多变量分析不仅包括检查分布,还包括这些属性之间的潜在关系、模式和相关性。你也可以根据需要解决的问题,利用推断统计(inferential statistics)和假设检验,检查不同属性、群体等的统计显著性(significance)。
可视化二维数据
f,ax=plt.subplots(figsize=(10,6))
corr=wines.corr()
hm=sns.heatmap(round(corr,2),annot=True,ax=ax,cmap="coolwarm",fmt=".2f",linewidth=.05)
f.subplots_adjust(top=0.93)
t=f.suptitle("Wine Attribute Correlation Heatmap",fontsize=14)
sns.pairplot(wines.iloc[:,[1,2,3]])
f.subplots_adjust(top=0.93)
f.suptitle("Wine Attribute Pairwise Plots",fontsize=14)
from pandas.plotting import parallel_coordinates

fig,axes = plt.subplots()
parallel_coordinates(wines.iloc[:,[7,3,6,0,12]],"wine_type",ax=axes)
plt.legend()
基本上,在如上所述的可视化中,点被表征为连接的线段。每条垂直线代表一个数据属性。所有属性中的一组完整的连接线段表征一个数据点。因此,趋于同一类的点将会更加接近。仅仅通过观察就可以清楚看到,与白葡萄酒相比,红葡萄酒的密度略高。与红葡萄酒相比,白葡萄酒的残糖和二氧化硫总量也较高,红葡萄酒的固定酸度高于白葡萄酒。查一下我们之前得到的统计表中的统计数据,看看能否验证这个假设!
让我们看看可视化两个连续型数值属性的方法。散点图和联合分布图(joint plot)是检查模式、关系以及属性分布的特别好的方法
#散点图描述硫酸盐与究竟含量的关系
plt.scatter(wines["sulphates"],wines["alcohol"],alpha=0.4,edgecolors='w')

plt.xlabel("Sulphates")
plt.ylabel("Alcohol")
plt.title("Wine Sulphates - Alcohol Content",y=1.05)

jp=sns.jointplot(x="sulphates",y="alcohol",data=wines,kind="reg",space=0,size=5,ratio=4)
#观察酒精含量与硫酸盐的联合分布图
#你可以查看联合分布图中的相关性、关系以及分布

如何可视化两个连续型数值属性?一种方法是为分类维度画单独的图(子图)或分面(facet)
#将两种类型的酒根据质量指标的频率进行作图,观察各种质量的酒的分布情况

fig=plt.figure(figsize=(10,4))
title=fig.suptitle("Wine Type - Quality",fontsize=14)
fig.subplots_adjust(top=0.85,wspace=0.3)

ax1=fig.add_subplot(1,2,1)
ax1.set_title("Red Wine")
ax1.set_xlabel("Quality")
ax1.set_ylabel("Frequency")

rw_q=red_wine["quality"].value_counts()
rw_q=(list(rw_q.index),list(rw_q.values))
ax1.set_ylim([0,2500])

ax1.tick_params(axis="both",which="major",labelsize=8.5)
bar1=ax1.bar(rw_q[0],rw_q[1],color="red",edgecolor="k",linewidth=1)

ax2 = fig.add_subplot(1,2, 2)
ax2.set_title("White Wine")
ax2.set_xlabel("Quality")
ax2.set_ylabel("Frequency")
ww_q = white_wine['quality'].value_counts()
ww_q = (list(ww_q.index), list(ww_q.values))
ax2.set_ylim([0, 2500])
ax2.tick_params(axis='both', which='major', labelsize=8.5)
bar2 = ax2.bar(ww_q[0], ww_q[1], color='c', edgecolor='k', linewidth=1)

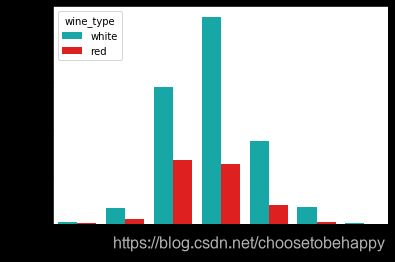
虽然这是一种可视化分类数据的好方法,但正如所见,利用matplotlib要编写大量的代码。另一个好方法是在单个图中为不同的属性画堆积条形图或多个条形图。可以很容易地利用seaborn做到
cp = sns.countplot(x="quality",hue="wine_type",data=wines,
                   palette={"red":"r","white":"c"})
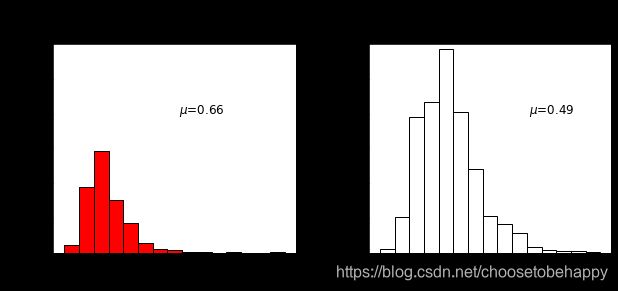
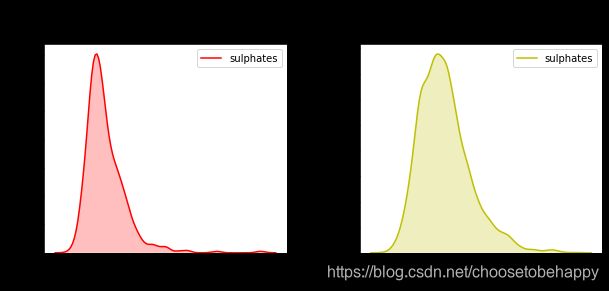
让我们看看可视化 2 维混合属性(大多数兼有数值和分类)。一种方法是使用分图\子图与直方图或核密度图。
#直方图分图
fig = plt.figure(figsize = (10,4))
title = fig.suptitle("Sulphates Content in Wine", fontsize=14)
fig.subplots_adjust(top=0.85, wspace=0.3)

ax1 = fig.add_subplot(1,2,1)
ax1.set_title("Red Wine")
ax1.set_xlabel("Sulphates")
ax1.set_ylabel("Frequency")
ax1.set_ylim([0, 1200])
ax1.text(1.2, 800, r'$\mu$='+str(round(red_wine['sulphates'].mean(),2)),
         fontsize=12)
r_freq, r_bins, r_patches = ax1.hist(red_wine['sulphates'], color='red', bins=15,
                                     edgecolor='black', linewidth=1)

ax2 = fig.add_subplot(1,2,2)
ax2.set_title("White Wine")
ax2.set_xlabel("Sulphates")
ax2.set_ylabel("Frequency")
ax2.set_ylim([0, 1200])
ax2.text(0.8, 800, r'$\mu$='+str(round(white_wine['sulphates'].mean(),2)),
         fontsize=12)
w_freq, w_bins, w_patches = ax2.hist(white_wine['sulphates'], color='white', bins=15,
                                     edgecolor='black', linewidth=1)


#核密度图分图
fig = plt.figure(figsize = (10, 4))
title = fig.suptitle("Sulphates Content in Wine", fontsize=14)
fig.subplots_adjust(top=0.85, wspace=0.3)

#描述红酒的硫酸盐含量
ax1 = fig.add_subplot(1,2, 1)
ax1.set_title("Red Wine")
ax1.set_xlabel("Sulphates")
ax1.set_ylabel("Density")
sns.kdeplot(red_wine['sulphates'], ax=ax1, shade=True, color='r')

#描述白酒的硫酸盐含量
ax2 = fig.add_subplot(1,2, 2)
ax2.set_title("White Wine")
ax2.set_xlabel("Sulphates")
ax2.set_ylabel("Density")
sns.kdeplot(white_wine['sulphates'], ax=ax2, shade=True, color='y')
fig = plt.figure(figsize=(6,4))
title = fig.suptitle("Sulphates Content in Wine",fontsize=14)
fig.subplots_adjust(top=0.85,wspace=0.3)
ax=fig.add_subplot(1,1,1)
ax.set_xlabel("Sulphates")
ax.set_ylabel("Frequency")

g=sns.FacetGrid(wines,hue="wine_type",palette={"red":"r","white":"y"})
g.map(sns.distplot,"sulphates",kde=False,bins=15,ax=ax)
ax.legend(title="Wine Type")
plt.close()
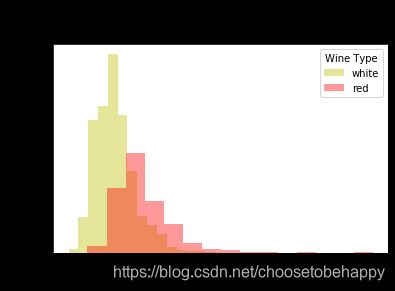
可以看到上面生成的图形清晰简洁,我们可以轻松地比较各种分布。除此之外,箱线图(box plot)是根据分类属性中的不同数值有效描述数值数据组的另一种方法。箱线图是了解数据中四分位数值以及潜在异常值的好方法。
f,ax=plt.subplots(1,1,figsize=(12,4))
f.suptitle("Wine Quality - ALcohol Content",fontsize=14)

sns.boxplot(x="quality",y="alcohol",data=wines,ax=ax)
ax.set_xlabel("Wine Quality",size=12,alpha=0.8)
ax.set_ylabel("Wine Alcohol %",size=12,alpha=0.8)
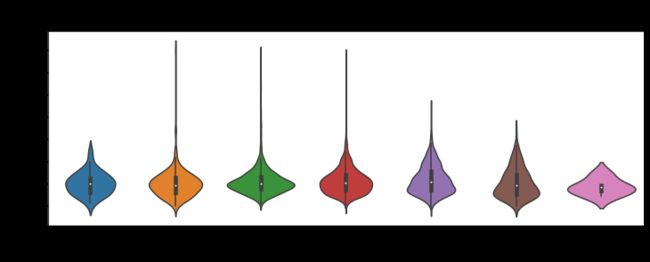
另一个类似的可视化是小提琴图,这是使用核密度图显示分组数值数据的另一种有效方法(描绘了数据在不同值下的概率密度)。
#描述酒的质量与硫酸盐含量的小提琴图

f,ax=plt.subplots(1,1,figsize=(12,4))
f.suptitle("Wine Quality - Sulphates Content",fontsize=14)

sns.violinplot(x="quality",y="sulphates",data=wines,ax=ax)
ax.set_xlabel("Wine Quality",size=12,alpha=0.8)
ax.set_ylabel("Wine Sulphates",size=12,alpha=0.8)
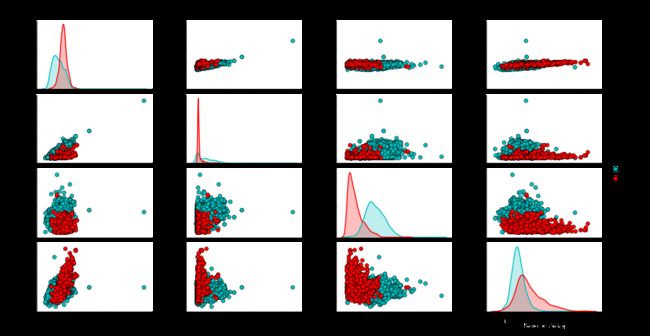
cols=["density","residual sugar","total sulfur dioxide","fixed acidity","wine_type"]
pp = sns.pairplot(wines[cols],hue="wine_type",size=1.8,aspect=1.8,
                 palette={"red":"r","white":"c"},
                 plot_kws=dict(edgecolor="k",linewidth=0.5))

fig=pp.fig

fig.subplots_adjust(top=0.93,wspace=0.3)
t=fig.suptitle("Wine Attributes Pairwise Plots",fontsize=14)
可视化三维数据
fig=plt.figure(figsize=(8,6))
ax=fig.add_subplot(111,projection="3d")

xs=wines["residual sugar"]
ys=wines["fixed acidity"]
zs=wines["alcohol"]
ax.scatter(xs,ys,zs,s=50,alpha=0.6,edgecolor="w")
我们还可以利用常规的 2 维坐标轴,并将尺寸大小的概念作为第 3 维(本质上是气泡图),其中点的尺寸大小表征第 3 维的数量。
plt.scatter(wines["fixed acidity"],wines["alcohol"],s=wines["residual sugar"]*25,alpha=0.4,edgecolor="w")
plt.xlabel("Fixed Acidity")
plt.ylabel("Alcohol")
plt.title("Wine Alcohol Content - Fixed Acidity - Residual Sugar",y=1.05)
#第三维以⭕大小进行对比
因此,你可以看到上面的图表不是一个传统的散点图,而是点(气泡)大小基于不同残糖量的的气泡图。当然,并不总像这种情况可以发现数据明确的模式,我们看到其它两个维度的大小也不同。
为了可视化 3 个离散型分类属性,我们可以使用常规的条形图,可以利用色调的概念以及分面或子图表征额外的第 3 个维度。seaborn 框架帮助我们最大程度地减少代码,并高效地绘图。
fc = sns.factorplot(x="quality",hue="wine_type",col="quality_label",data=wines,
                    kind="count",palette={"red":"r","white":"c"})

上面的图表清楚地显示了与每个维度相关的频率,可以看到,通过图表能够容易有效地理解相关内容。
考虑到可视化 3 维混合属性,我们可以使用色调的概念来将其中一个分类属性可视化,同时使用传统的如散点图来可视化数值属性的 2 个维度。
#通过散点图和色调的概念进行三维数据的可视化
jp = sns.pairplot(wines,x_vars=["sulphates"],y_vars=["alcohol"],size=4.5,
                 hue="wine_type",palette={"red":"r","white":"c"},
                 plot_kws=dict(edgecolor="k",linewidth=0.5))

lp=sns.lmplot(x="sulphates",y="alcohol",hue="wine_type",
             palette={"red":"r","white":"c"},
             data=wines,fit_reg=True,legend=True,
             scatter_kws=dict(edgecolor="k",linewidth=0.5))
因此,色调作为类别或群体的良好区分,虽然如上图观察没有相关性或相关性非常弱,但从这些图中我们仍可以理解,与白葡萄酒相比,红葡萄酒的硫酸盐含量较高。你也可以使用核密度图代替散点图来理解 3 维数据。
ax = sns.kdeplot(white_wine["sulphates"],white_wine["alcohol"],
                cmap="YlOrBr", shade=True, shade_lowest=False)
ax = sns.kdeplot(red_wine["sulphates"],red_wine["alcohol"],
                cmap="Reds", shade=True, shade_lowest=False)
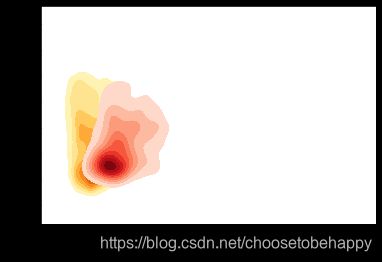
与预期一致且相当明显,红葡萄酒样品比白葡萄酒具有更高的硫酸盐含量。你还可以根据色调强度查看密度浓度。
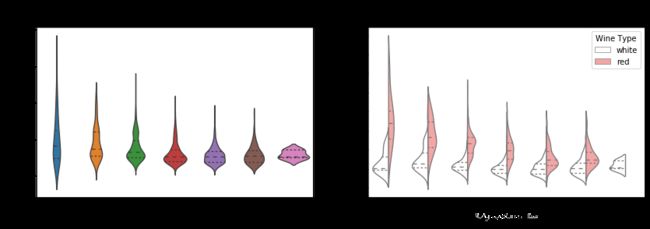
如果我们正在处理有多个分类属性的 3 维数据,我们可以利用色调和其中一个常规轴进行可视化,并使用如箱线图或小提琴图来可视化不同的数据组。
f, (ax1, ax2) = plt.subplots(1, 2, figsize=(14, 4))
f.suptitle('Wine Type - Quality - Acidity', fontsize=14)

sns.violinplot(x="quality", y="volatile acidity",
               data=wines, inner="quart", linewidth=1.3,ax=ax1)
ax1.set_xlabel("Wine Quality",size = 12,alpha=0.8)
ax1.set_ylabel("Wine Volatile Acidity",size = 12,alpha=0.8)

sns.violinplot(x="quality", y="volatile acidity", hue="wine_type",
               data=wines, split=True, inner="quart", linewidth=1.3,
               palette={"red": "#FF9999", "white": "white"}, ax=ax2)
ax2.set_xlabel("Wine Quality",size = 12,alpha=0.8)
ax2.set_ylabel("Wine Volatile Acidity",size = 12,alpha=0.8)
l = plt.legend(loc='upper right', title='Wine Type')
在上图中,我们可以看到,在右边的 3 维可视化图中,我们用 x 轴表示葡萄酒质量,wine_type 用色调表征。我们可以清楚地看到一些有趣的见解,例如与白葡萄酒相比红葡萄酒的挥发性酸度更高。
你也可以考虑使用箱线图来代表具有多个分类变量的混合属性。
f,(ax1,ax2)=plt.subplots(1,2,figsize=(14,4))
f.suptitle("Wine Type - Quality - Alcohol Content",fontsize=14)

sns.boxplot(x="quality",y="alcohol",hue="wine_type",
           data=wines,palette={"red":"r","white":"c"},ax=ax1)
ax1.set_xlabel("Wine Quality",size=12,alpha=0.8)
ax1.set_ylabel("Wine Alcohol %",size=12,alpha=0.8)

sns.boxplot(x="quality_label",y="alcohol",hue="wine_type",
           data=wines,palette={"red":"r","white":"c"},ax=ax2)
ax2.set_xlabel("Wine Quality",size=12,alpha=0.8)
ax2.set_ylabel("Wine Alcohol %",size=12,alpha=0.8)
l=plt.legend(loc="best",title="Wine Type")

我们可以看到,对于质量和 quality_label 属性,葡萄酒酒精含量都会随着质量的提高而增加。另外红葡萄酒与相同品质类别的白葡萄酒相比具有更高的酒精含量(中位数)。然而,如果检查质量等级,我们可以看到,对于较低等级的葡萄酒(3 和 4),白葡萄酒酒精含量(中位数)大于红葡萄酒样品。否则,红葡萄酒与白葡萄酒相比似乎酒精含量(中位数)略高。
可视化四维数据
可视化 4 维数据的方法是在传统图如散点图中利用深度和色调表征特定的数据维度。
fig = plt.figure(figsize=(8, 6))
t = fig.suptitle('Wine Residual Sugar - Alcohol Content - Acidity - Type', fontsize=14)
ax = fig.add_subplot(111, projection='3d')

xs = list(wines['residual sugar'])
ys = list(wines['alcohol'])
zs = list(wines['fixed acidity'])
data_points = [(x, y, z) for x, y, z in zip(xs, ys, zs)]
colors = ['red' if wt == 'red' else 'yellow' for wt in list(wines['wine_type'])]

for data, color in zip(data_points, colors):
    x, y, z = data
    ax.scatter(x, y, z, alpha=0.4,edgecolor="k",c=color,s=30)

ax.set_xlabel('Residual Sugar')
ax.set_ylabel('Alcohol')
ax.set_zlabel('Fixed Acidity')
wine_type 属性由上图中的色调表征得相当明显。此外,由于图的复杂性,解释这些可视化开始变得困难,但我们仍然可以看出,例如红葡萄酒的固定酸度更高,白葡萄酒的残糖更高。当然,如果酒精和固定酸度之间有某种联系,我们可能会看到一个逐渐增加或减少的数据点趋势。
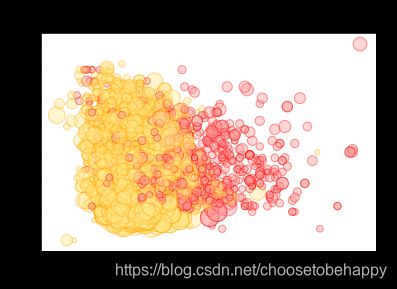
另一个策略是使用二维图,但利用色调和数据点大小作为数据维度。通常情况下,这将类似于气泡图等我们先前可视化的图表。
size = wines['residual sugar']*25
fill_colors = ['#FF9999' if wt=='red' else '#FFE888' for wt in list(wines['wine_type'])]
edge_colors = ['red' if wt=='red' else 'orange' for wt in list(wines['wine_type'])]

plt.scatter(wines['fixed acidity'], wines['alcohol'], s=size,
            alpha=0.4, color=fill_colors, edgecolors=edge_colors)

plt.xlabel('Fixed Acidity')
plt.ylabel('Alcohol')
plt.title('Wine Alcohol Content - Fixed Acidity - Residual Sugar - Type',y=1.05);
我们用色调代表 wine_type 和数据点大小代表残糖。我们确实看到了与前面图表中观察到的相似模式,白葡萄酒气泡尺寸更大表征了白葡萄酒的残糖值更高。
如果我们有多于两个分类属性表征,可在常规的散点图描述数值数据的基础上利用色调和分面来描述这些属性。我们来看几个实例。
g = sns.FacetGrid(wines,col="wine_type",hue="quality_label",
                 col_order=["red","white"],hue_order=["low","medium","high"],
                  aspect=1.2,size=3.5,palette=sns.light_palette("navy",4)[1:])
g.map(plt.scatter,"volatile acidity","alcohol",alpha=0.9,
      edgecolor='white', linewidth=0.5, s=100)
fig = g.fig
fig.subplots_adjust(top=0.8, wspace=0.3)
fig.suptitle('Wine Type - Alcohol - Quality - Acidity', fontsize=14)
l = g.add_legend(title='Wine Quality Class')
这种可视化的有效性使得我们可以轻松识别多种模式。白葡萄酒的挥发酸度较低,同时高品质葡萄酒具有较低的酸度。也基于白葡萄酒样本,高品质的葡萄酒有更高的酒精含量和低品质的葡萄酒有最低的酒精含量!
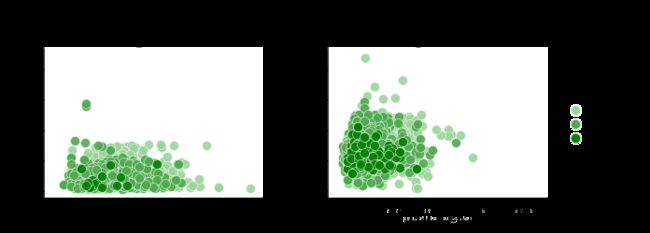
让我们借助一个类似实例,并建立一个 4 维数据的可视化。
g = sns.FacetGrid(wines, col="wine_type", hue='quality_label',
                  col_order=['red', 'white'], hue_order=['low', 'medium', 'high'],
                  aspect=1.2, size=3.5, palette=sns.light_palette('green', 4)[1:])
g.map(plt.scatter, "volatile acidity", "total sulfur dioxide", alpha=0.9,
      edgecolor='white', linewidth=0.5, s=100)
fig = g.fig
fig.subplots_adjust(top=0.8, wspace=0.3)
fig.suptitle('Wine Type - Sulfur Dioxide - Acidity - Quality', fontsize=14)
l = g.add_legend(title='Wine Quality Class')
我们清楚地看到,高品质的葡萄酒有较低的二氧化硫含量,这是非常相关的,与葡萄酒成分的相关领域知识一致。我们也看到红葡萄酒的二氧化硫总量低于白葡萄酒。在几个数据点中,红葡萄酒的挥发性酸度水平较高。
可视化 5 维数据
我们照旧遵从上文提出的策略,要想可视化 5 维数据,我们要利用各种绘图组件。我们使用深度、色调、大小来表征其中的三个维度。其它两维仍为常规轴。因为我们还会用到大小这个概念,并借此画出一个三维气泡图。
fig = plt.figure(figsize=(8, 6))
ax = fig.add_subplot(111, projection='3d')
t = fig.suptitle('Wine Residual Sugar - Alcohol Content - Acidity - Total Sulfur Dioxide - Type', fontsize=14)

xs = list(wines['residual sugar'])
ys = list(wines['alcohol'])
zs = list(wines['fixed acidity'])

data_points = [(x, y, z) for x, y, z in zip(xs, ys, zs)]

sizes = list(wines['total sulfur dioxide'])
colors = ['red' if wt == 'red' else 'yellow' for wt in list(wines['wine_type'])]

for data, color, size in zip(data_points, colors, sizes):
    x, y, z = data
    ax.scatter(x, y, z, alpha=0.4, c=color, edgecolors='k', s=size)

ax.set_xlabel('Residual Sugar')
ax.set_ylabel('Alcohol')
ax.set_zlabel('Fixed Acidity')
气泡图灵感来源与上文所述一致。但是,我们还可以看到以二氧化硫总量为指标的点数,发现白葡萄酒的二氧化硫含量高于红葡萄酒。
除了深度之外,我们还可以使用分面和色调来表征这五个数据维度中的多个分类属性。其中表征大小的属性可以是数值表征甚至是类别(但是我们可能要用它的数值表征来表征数据点大小)。由于缺乏类别属性,此处我们不作展示,但是你可以在自己的数据集上试试。
g = sns.FacetGrid(wines, col="wine_type", hue='quality',
                  col_order=['red', 'white'], hue_order=['low', 'medium', 'high'],
                  aspect=1.2, size=3.5, palette=sns.light_palette("red", 4)[1:])

g.map(plt.scatter, "residual sugar", "alcohol", alpha=0.9,
          edgecolor='white', linewidth=0.5, s=100)

fig = g.fig
fig.subplots_adjust(top=0.8, wspace=0.3)
fig.suptitle('Wine Type - Sulfur Dioxide - Residual Sugar - Alcohol - Quality', fontsize=14)
l = g.add_legend(title='Wine Quality Class')
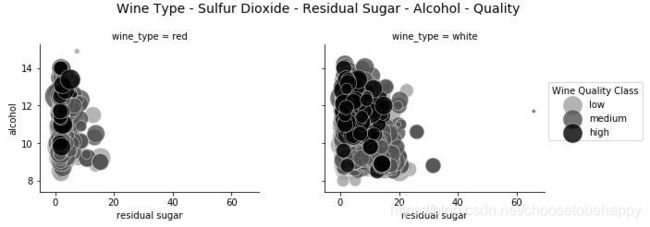
通常还有一个前文介绍的 5 维数据可视化的备选方法。当看到我们先前绘制的图时,很多人可能会对多出来的维度深度困惑。该图重复利用了分面的特性,所以仍可以在 2 维面板上绘制出来且易于说明和绘制。
我们已经领略到多位数据可视化的复杂性!如果还有人想问,为何不增加维度?让我们继续简单探索下!
可视化 6 维数据(6-D)
我们继续在可视化中添加一个数据维度。我们将利用深度、色调、大小和形状及两个常规轴来描述所有 6 个数据维度。
我们将利用散点图和色调、深度、形状、大小的概念来可视化 6 维数据。
fig = plt.figure(figsize=(8, 6))
t = fig.suptitle('Wine Residual Sugar - Alcohol Content - Acidity - Total Sulfur Dioxide - Type - Quality', fontsize=14)
ax = fig.add_subplot(111, projection='3d')

xs = list(wines['residual sugar'])
ys = list(wines['alcohol'])
zs = list(wines['fixed acidity'])
data_points = [(x, y, z) for x, y, z in zip(xs, ys, zs)]

ss = list(wines['total sulfur dioxide'])
colors = ['red' if wt == 'red' else 'yellow' for wt in list(wines['wine_type'])]
markers = [',' if q == 'high' else 'x' if q == 'medium' else 'o' for q in list(wines['quality_label'])]

for data, color, size, mark in zip(data_points, colors, ss, markers):
    x, y, z = data
    ax.scatter(x, y, z, alpha=0.4, c=color, edgecolors='k', s=size, marker=mark)

ax.set_xlabel('Residual Sugar')
ax.set_ylabel('Alcohol')
ax.set_zlabel('Fixed Acidity')
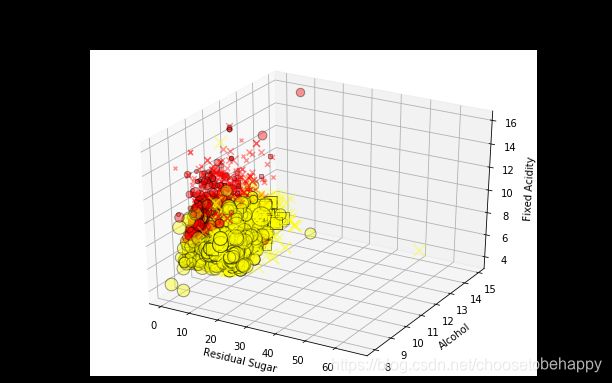
这可是在一张图上画出 6 维数据!我们用形状表征葡萄酒的质量标注,优质(用方块标记),一般(用 x 标记),差(用圆标记):用色调表示红酒的类型,由深度和数据点大小确定的酸度表征总二氧化硫含量。
这个解释起来可能有点费劲,但是在试图理解多维数据的隐藏信息时,最好结合一些绘图组件将其可视化。
- 结合形状和 y 轴的表现,我们知道高中档的葡萄酒的酒精含量比低质葡萄酒更高。
- 结合色调和大小的表现,我们知道白葡萄酒的总二氧化硫含量比红葡萄酒更高。
- 结合深度和色调的表现,我们知道白葡萄酒的酸度比红葡萄酒更低。
- 结合色调和 x 轴的表现,我们知道红葡萄酒的残糖比白葡萄酒更低。
- 结合色调和形状的表现,似乎白葡萄酒的高品质产量高于红葡萄酒。(可能是由于白葡萄酒的样本量较大)
我们也可以用分面属性来代替深度构建 6 维数据可视化效果。
 g = sns.FacetGrid(wines, row='wine_type', col="quality", hue='quality_label', size=4)
 g.map(plt.scatter, "residual sugar", "alcohol", alpha=0.5,
 edgecolor='k', linewidth=0.5, s=wines['total sulfur dioxide']*2)
 fig = g.fig
 fig.set_size_inches(18, 8)
 fig.subplots_adjust(top=0.85, wspace=0.3)
 fig.suptitle('Wine Type - Sulfur Dioxide - Residual Sugar - Alcohol - Quality Class - Quality Rating', fontsize=14)
 l = g.add_legend(title='Wine Quality Class')
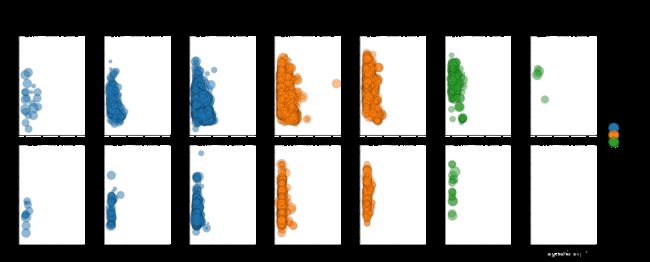
因此,在这种情况下,我们利用分面和色调来表征三个分类属性,并使用两个常规轴和大小来表征 6 维数据可视化的三个数值属性。
结论
数据可视化与科学一样重要。我们的目的不是为了记住所有数据,也不是给出一套固定的数据可视化规则。本文的主要目的是理解并学习高效的数据可视化策略,尤其是当数据维度增大时。以致我们可以用本文的知识可视化我们自己的数据集。
