MATLAB指令
01--根据数学公式进行绘制
1.绘制连续函数
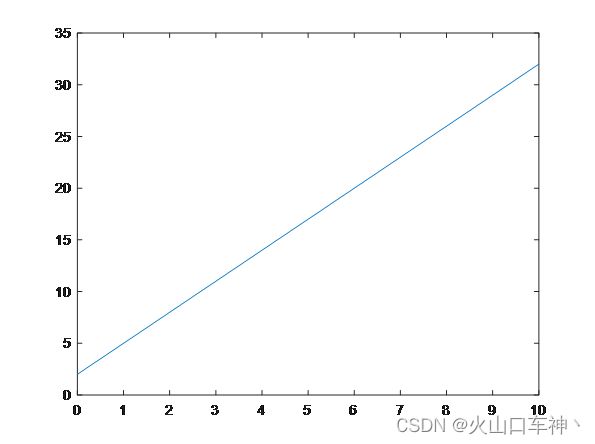
①一元函数
t=0:0.1:10; y=3*t+2; plot(t,y)
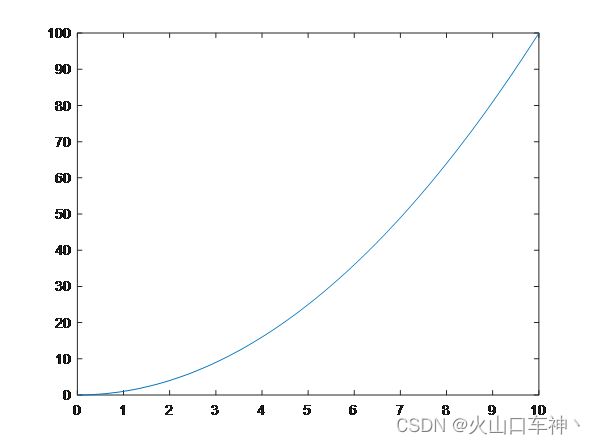
②一元二次函数
t=0:0.1:10; y=t.*t; plot(t,y)
注意此处应为点乘
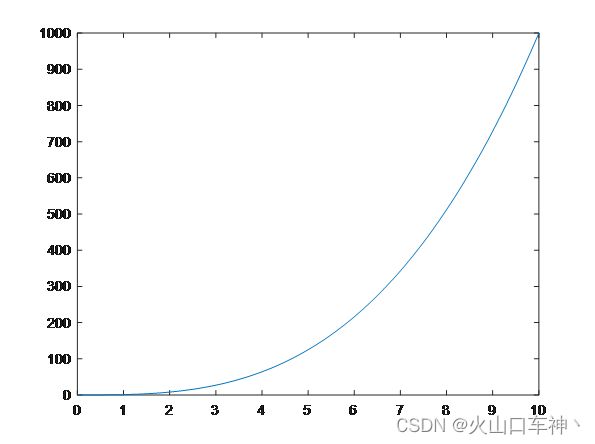
③一元3次
t=0:0.1:10; y=t.*t.*t; plot(t,y)
④y=1/t
t=0:0.1:10; y=1./t; plot(t,y)

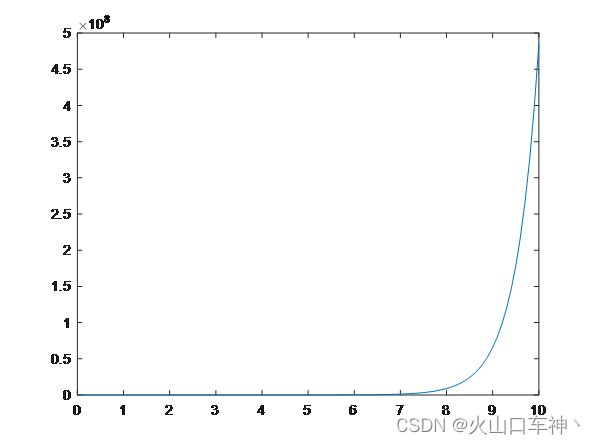
⑤y=exp(t)
t=0:0.1:10; y=exp(2*t); plot(t,y)
⑥y=sin(t)
t=0:0.1:10; y=sin(2*t+0.5*pi); plot(t,y)

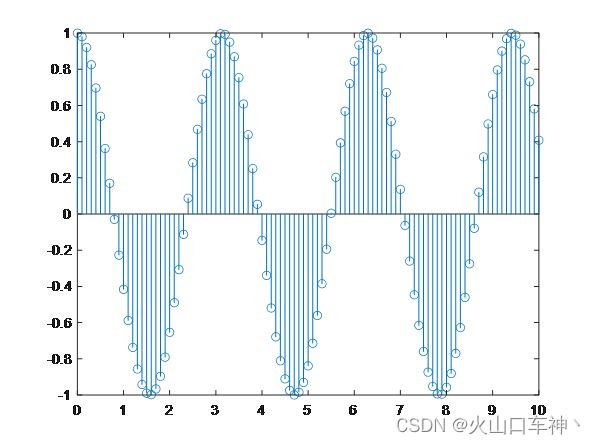
2.绘制离散函数
若想绘制离散函数点,则使用指令stem
t=0:0.1:10; y=sin(2*t+0.5*pi); stem(t,y)
02--常用的绘制指令
先取时间t
t=0:0.1:10;
绘制如下曲线:
y=sin(2*t+0.5*pi);
plot(t,y)

length
取点的个数
L=length(y);
rand
随机数,若直接用rand就是随机一个数,若用arand(x,y) 则随机x行y列的振幅为a的数
比如 >>a=1.5*rand(2,3)
a =
0.6461 1.1498 0.5142
1.4633 0.5251 0.7826
继续在前面的算式中按如下绘制
z=y+1.2*rand(1,L); plot(t,z)

subplot
如果想要同时显示2个窗口,则使用该指令
subplot - 在平铺位置创建坐标区
此 MATLAB 函数 将当前图窗划分为 m×n 网格,并在 p 指定的位置创建坐标区。MATLAB
按行号对子图位置进行编号。第一个子图是第一行的第一列,第二个子图是第一行的第二列,依此类推。如果指定的位置已存在坐标区,则此命令会将该坐标区设为当前坐标区。
subplot(m,n,p)
subplot(m,n,p,'replace')
subplot(m,n,p,'align')
subplot(m,n,p,ax)
subplot('Position',pos)
subplot(___,Name,Value)
ax = subplot(___)
subplot(ax)
title
加标题
>> t=0:0.1:10; y=sin(2*t+0.5*pi); z=y+1.2*rand(1,L);subplot(2,1,1); plot(t,z)
>> title('sin随机曲线','fontweight','bold');
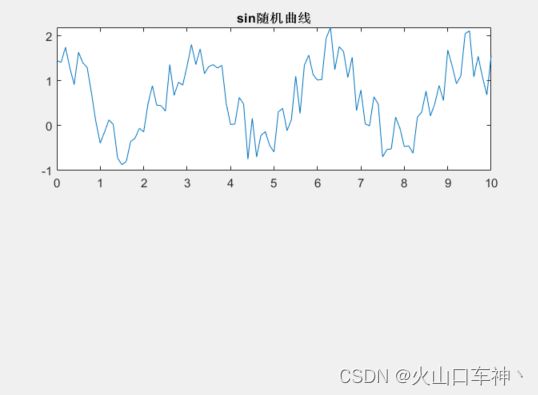
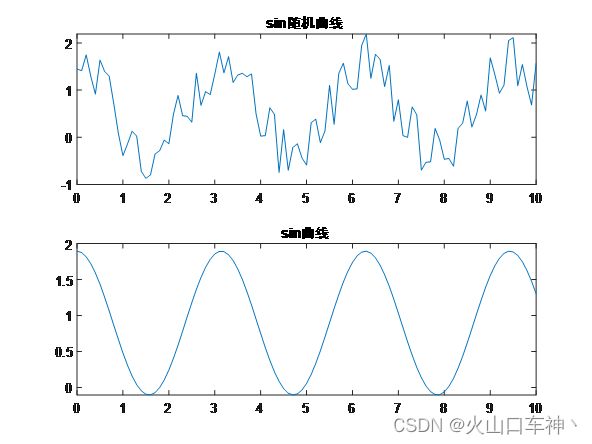
这里的subplot指的是2行1列,在第一个位置绘图
例如我们想在第二个位置绘图,那么可以先把subplot挪到第2个位置
>> subplot(2,1,2);
绘制一个sin曲线
>> z=y+1.2*rand;
>> plot(t,z)
>> title('sin曲线','fontweight','bold');
结果:
如果想再返回第一个图绘制,则继续挪位置到第一个图
>> subplot(2,1,1);
>> title('sin随机1曲线','fontweight','bold');

若想绘制多个图只需要去改变行列数值就行了
例如有2行2列四个图
>> t=0:0.1:10; y=sin(2*t+0.5*pi); z=y+1.2*rand(1,L);subplot(2,2,1); plot(t,z)
>> t=0:0.1:10; y=sin(2*t+0.5*pi); z=y+1.2*rand;subplot(2,2,2); plot(t,z)
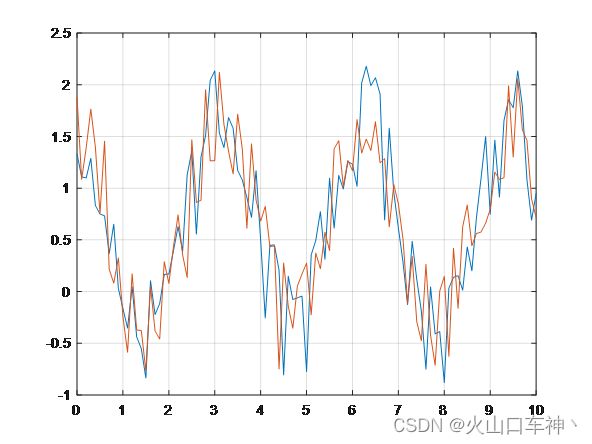
>> t=0:0.01:10; y=sin(2*t+0.5*pi); z=y+t;subplot(2,2,3); plot(t,z)
>> t=0:0.1:10; y=sin(2*t+0.5*pi); z=y+1.2*rand(2,L);subplot(2,2,4); plot(t,z)

grid
会把当前的绘制图加上表格线
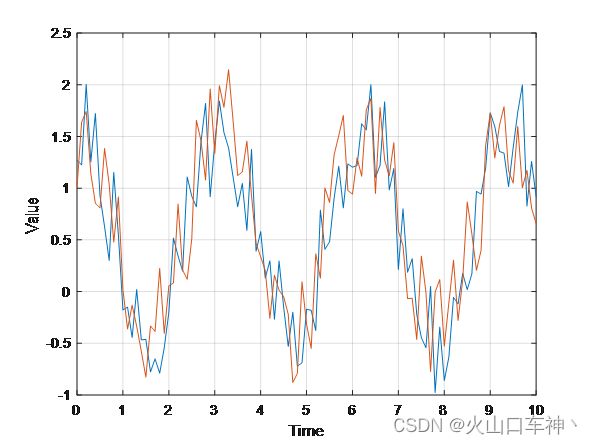
>> t=0:0.1:10; y=sin(2*t+0.5*pi); z=y+1.2*rand(2,101); plot(t,z)
>> grid
xabel,ylabel
xlabel - 为 x 轴添加标签
此 MATLAB 函数 将为 gca 命令返回的当前坐标区或图的 x 轴添加标签。重新发出 xlabel 命令会将旧标签替换为新标签。
xlabel(txt)
xlabel(target,txt)
xlabel(___,Name,Value)
t = xlabel(___)
>> xlabel('Time')
>> ylabel('Value')
冷end
更详细的参考帮助文档
simulink相关
打开模型
open_system('模型名字')
运行模型
sim('模型名字')
未完待续。。