回归预测 | Matlab实现基于GA-Elman遗传算法优化神经网络多输入单输出回归预测
回归预测 | Matlab实现基于GA-Elman遗传算法优化神经网络多输入单输出回归预测
目录
-
- 回归预测 | Matlab实现基于GA-Elman遗传算法优化神经网络多输入单输出回归预测
-
- 效果一览
- 基本介绍
- 程序设计
- 参考资料
效果一览
基本介绍
1.Matlab实现基于GA-Elman遗传算法优化神经网络多输入单输出回归预测(完整源码和数据)
2.数据集为excel,输入多个特征,输出1个变量,运行主程序GA_Elman即可,其余为函数文件,无需运行,程序含优化前后对比;
3.运行环境Matlab2018b及以上.
4.代码特点:参数化编程、参数可方便更改、代码编程思路清晰、注释明细。
程序设计
- 完整源码和数据获取方式(资源出下载):Matlab实现基于GA-Elman遗传算法优化神经网络多输入单输出回归预测。
%%  ELMAN神经网络
%%  网络创建
net = newelm(p,t,S1,{'tansig','purelin'},'trainlm');

%% 设置训练参数
net.trainParam.show = 10;
net.trainParam.epochs = 2000;
net.trainParam.goal = 1.0e-3;
net.trainParam.lr = 0.1;

%%  网络训练
[net,tr] = train(net,p,t);

%% 仿真测试
s_elman = sim(net,P_test);    % Elman神经网络的仿真结果

%% GA-Elman神经网络
R = size(p,1);
S2 = size(t,1);
S = R*S1 + S1*S2 + S1 + S2;
aa = ones(S,1)*[-1,1];

%%  遗传算法优化
%%  初始化种群
popu = 100;  % 种群规模
initPpp = initializega(popu,aa,'gaelmanEval',[],[1e-6 1]);  % 初始化种群

%% 迭代优化
gen = 100;  % 遗传代数
% 调用GAOT工具箱,其中目标函数定义为gabpEval
[x,endPop,bPop,trace] = ga(aa,'gaelmanEval',[],initPpp,[1e-6 1 0],'maxGenTerm',gen,...
                           'normGeomSelect',[0.09],['arithXover'],[2],'nonUnifMutation',[2 gen 3]);
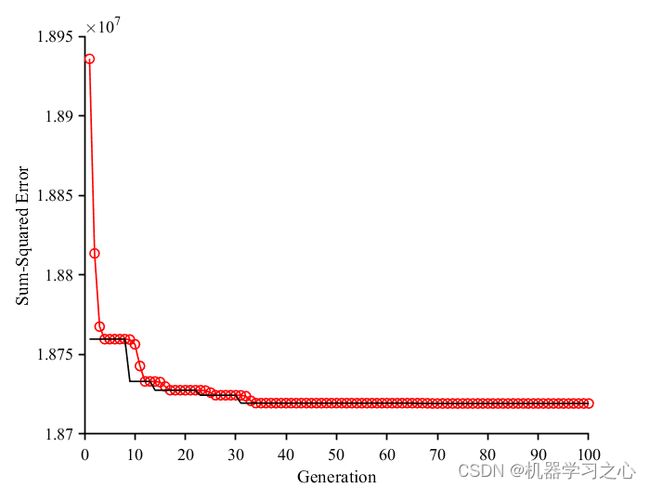
%% 绘均方误差变化曲线
figure(1)
plot(trace(:,1),1./trace(:,3),'r-o','linewidth',1);
hold on
plot(trace(:,1),1./trace(:,2),'k-','linewidth',1);
xlabel('Generation');
ylabel('Sum-Squared Error');
set(gca, 'Box','off' , ...
  'TickDir','out', ...
  'TickLength',[.01 .01] , ...
  'XColor', [0 0 0], ...
  'YColor', [0 0 0], ...
  'FontSize',10.5,...
  'FontName','Times New Roman',...
  'LineWidth', 1);
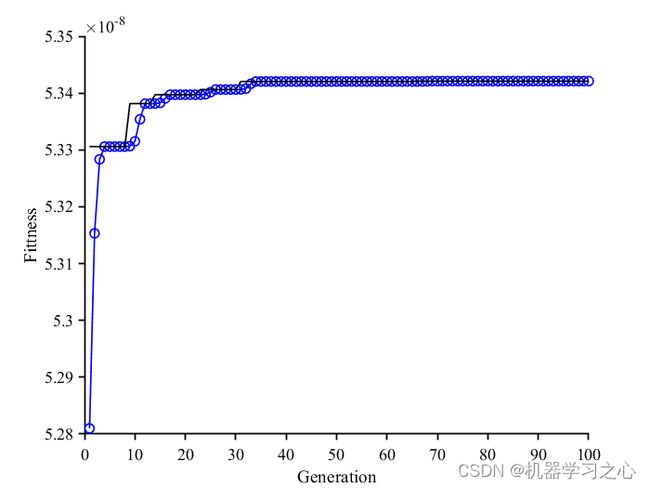
%%  绘制适应度函数变化
figure(2)
plot(trace(:,1),trace(:,3),'b-o','linewidth',1);
hold on
plot(trace(:,1),trace(:,2),'k-','linewidth',1);
xlabel('Generation');
ylabel('Fittness');
参考资料
[1] https://blog.csdn.net/kjm13182345320/article/details/129215161
[2] https://blog.csdn.net/kjm13182345320/article/details/128105718


