Python 可视化 web 神器:streamlit、Gradio、dash、nicegui;低代码 Python Web 框架:PyWebIO
官网:https://streamlit.io/
github:https://github.com/streamlit/streamlit
API 参考:https://docs.streamlit.io/library/api-reference
最全 Streamlit 教程:https://juejin.cn/column/7265946243196436520
Streamlit-中文文档:https://github.com/wanghanbinpanda/Streamlit-Documentation-Chinese/blob/main/README.md
Gradio、Streamlit、Dash、nicegui
框架对比:Gradio、Streamlit 和 Dash:https://zhuanlan.zhihu.com/p/611828558
在机器学习领域,针对已经训练好的模型创建一个快速的 Demo 通常是必要的,下面是快速创建机器学习应用的几个框架:gradio、streamit 和 dash 进行简单的对比。
| gradio | streamit | dash | |
|---|---|---|---|
| 主要使用场景 | 可交互小 Demo | 工作流、DashBoard | DashBoard、生产环境的复杂演示应用 |
| 上手难度 | 简单 | 简单 | 中等 |
| 组件丰富度 | 低 | 高 | 高 |
| 综合扩展性 | 低 | 中 | 高 |
| Jupyter Notebook 内支持 | 是 | 否 | 是 |
| 是否完全开源 | 是 | 是 | 部分企业级功能未开源 |
| github stars | 13.4k | 23.1k | 18.2k |
| 案例列表 | GitHub - gradio-app/awesome-demos: links and status of cool gradio demos | App Gallery • Streamlit | Dash Enterprise |
nicegui
官网:https://nicegui.io/
github:https://github.com/zauberzeug/nicegui/
nicegui 中文文档:nicegui-reference-cn:https://zhuanlan.zhihu.com/p/661187865
在 Python 3.10 及更高版本中,collections模块被重构,MutableMapping 已经被弃用。
安装:pip install nicegui
NiceGUI 基于FastAPI,封装了Quasar、Vue、Tailwind CSS、AG Grid、ECharts等,可以用来快速开发web或桌面程序。
1、streamlit 简介
streamlit 简介
Streamlit 是Python可视化 web 神器 ,是一个开箱即用的工具集,可以让开发者免于学习繁杂的前端知识,仅需几行代码就可以轻松、快速的构建一个简洁、优雅、令人惊叹的可视化 web app 应用。用于机器学习、数据可视化。当快速搭建一个 web app 的时候 Streamlit 绝对是开发神器。
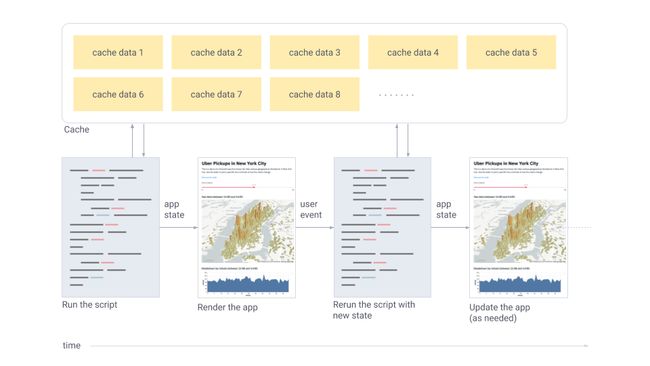
Streamlit 工作流程
:https://docs.streamlit.io/get-started/fundamentals/summary
- Streamlit 应用程序是从上到下运行的Python脚本
- 对于用户的每一次交互,整个脚本从头到尾执行一遍
- 当脚本执行时,Streamlit 在浏览器中实时绘制其输出
- Streamlit 使用缓存来避免重复请求数据或重复计算
- 每次用户与小部件交互时脚本都会重新执行,在该运行期间该小组件的输出值将重新设置。
- Streamlit 应用可以包含多个页面,这些页面在pages文件夹中的单独.py文件中定义。
2、简单使用
安装:pip install -i https://pypi.douban.com/simple streamlit
Streamlit 提供了一些入门示例,执行命令即可:streamlit hello
执行后会自动打开浏览器加载一个本地页面 http://localhost:8501/
这里面有很多的 demo,可以看下这些 Demo 还有对应的配套代码。代码直接拷贝保存,就可以在本地直接通过如下命令直接运行:streamlit run st-demo.py
Streamlit 使用 速查表
- Install & Import 安装和导入
- Command line 命令行
- Pre-release features 预发布功能
- Magic commands 魔术命令
- Display text 显示文本
- Display data 显示数据
- Display media 显示媒体
- Display charts 显示图表
- Add widgets to sidebar 将小部件添加到侧边栏
- Columns 列
- Tabs 制表符
- Control flow 控制流
- Display interactive widgets显示交互式小部件
- Build chat-based apps 构建基于聊天的应用
- Mutate data 更改数据
- Display code 显示代码
- Placeholders, help, and options占位符、帮助和选项
- Connect to data sources连接到数据源
- Optimize performance 优化性能
- Cache data objects 缓存数据对象
怎么运行 Streamlit
:https://docs.streamlit.io/knowledge-base/using-streamlit/how-do-i-run-my-streamlit-script
运行 streamlit 方法:( Ctrl + c 结束运行 )
- 方法 1:streamlit run your_script.py [-- script args]
- 方法 2:streamlit run https://raw.githubusercontent.com/streamlit/demo-uber-nyc-pickups/master/streamlit_app.py
- 方法 3:python -m streamlit run your_script.py
- 方法 4:streamlit run your_script.py
import sys
import streamlit as st
from streamlit import runtime
from streamlit.web import cli as stcli


def my_web_app():
    # markdown
    st.markdown('Streamlit markdown')
    st.header('Streamlit Demo')


def main():
    if runtime.exists():
        my_web_app()
    else:
        sys.argv = ["streamlit", "run", sys.argv[0]]
        sys.exit(stcli.main())


if __name__ == '__main__':
    main()
Python 直接执行:python temp_test.py
浏览器中直接访问 URL
Markdown 文本
导入 streamlit 后,就可以直接使用 st.markdown() 初始化,调用不同的方法,就可以往文档对象中填入内容
- st.title():文章大标题
- st.header():一级标题
- st.subheader():二级标题
- st.text():文本
- st.code():代码,同时可设置代码的语言,显示的时候会高亮
- st.latex():latex 公式
- st.caption():小字体文本
示例:
import streamlit as st

# markdown
st.markdown('Streamlit Demo')

# 设置网页标题
st.title('一个傻瓜式构建可视化 web的 Python 神器 -- streamlit')

# 展示一级标题
st.header('1. 安装')

st.text('和安装其他包一样,安装 streamlit 非常简单,一条命令即可')
code1 = '''pip3 install streamlit'''
st.code(code1, language='bash')


# 展示一级标题
st.header('2. 使用')

# 展示二级标题
st.subheader('2.1 生成 Markdown 文档')

# 纯文本
st.text('导入 streamlit 后,就可以直接使用 st.markdown() 初始化')

# 展示代码,有高亮效果
code2 = '''import streamlit as st
st.markdown('Streamlit Demo')'''
st.code(code2, language='python')
Streamlit 运行的方式 与普通的脚本 有所不同,命令行执行:streamlit run st-demo.py
数据 图表
关于数据的展示,streamlit 由两个组件进行支持
- table:普通的表格,用于静态数据的展示
- dataframe:高级的表格,可以进行数据的操作,比如排序
表格
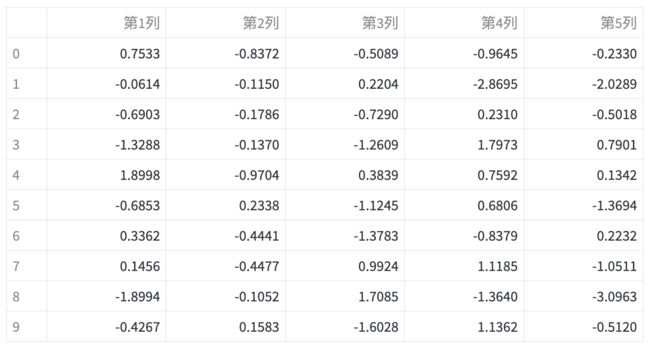
Table 的示例
df = pd.DataFrame(
    np.random.randn(10, 5),
    columns=('第%d列' % (i+1) for i in range(5))
)

st.table(df)
Datafram 的示例
df = pd.DataFrame(
    np.random.randn(10, 5),
    columns=('第%d列' % (i+1) for i in range(5))
)

st.dataframe(df.style.highlight_max(axis=0))
其实还有 n 多种样式,都可以在源代码中找到示例,比如:
- highlight_null:空值高亮
- highlight_min:最小值高亮
- highlight_max:最大值高亮
- highlight_between:某区间内的值高亮
- highlight_quantile:暂没用过
监控组件
在采集到一些监控数据后,若你需要做一个监控面板, streamlit 也为你提供的 metric 组件
示例:创建 三个指标,并且填入对应的数据
col1, col2, col3 = st.columns(3)
col1.metric("Temperature", "70 °F", "1.2 °F")
col2.metric("Wind", "9 mph", "-8%")
col3.metric("Humidity", "86%", "4%")
刷新页面,就能看到下面的效果
原生图表组件
Streamlit 原生支持多种图表:
- st.line_chart:折线图
- st.area_chart:面积图
- st.bar_chart:柱状图
- st.map:地图
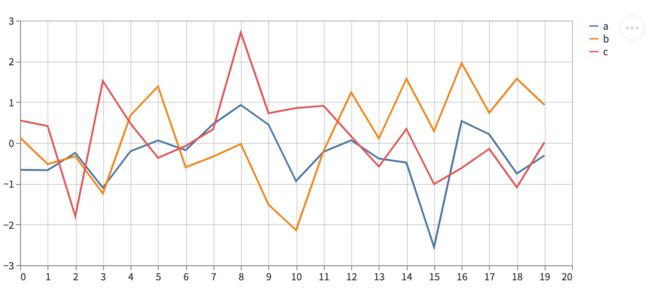
折线图
chart_data = pd.DataFrame(
    np.random.randn(20, 3),
    columns=['a', 'b', 'c'])

st.line_chart(chart_data)
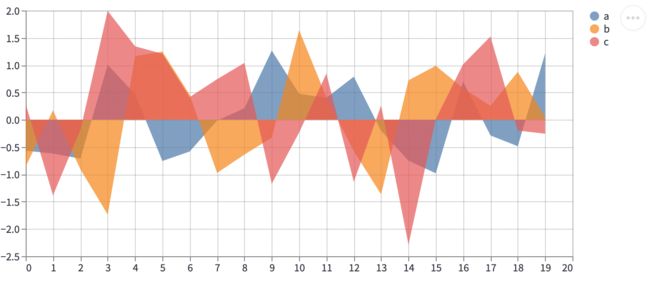
面积图
chart_data = pd.DataFrame(
    np.random.randn(20, 3),
    columns = ['a', 'b', 'c'])

st.area_chart(chart_data)
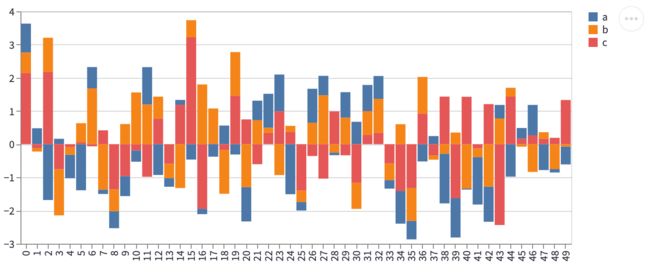
柱状图
chart_data = pd.DataFrame(
    np.random.randn(50, 3),
    columns = ["a", "b", "c"])
st.bar_chart(chart_data)
地图
df = pd.DataFrame(
    np.random.randn(1000, 2) / [50, 50] + [37.76, -122.4],
    columns=['lat', 'lon']
)
st.map(df)
外部图表组件
Streamlit 的一些原生图表组件,虽然做到了傻瓜式,但仅能输入数据、高度和宽度,如果你想更漂亮的图表,就像 matplotlib.pyplot、Altair、vega-lite、Plotly、Bokeh、PyDeck、Graphviz 那样,streamlit 也提供了支持:
- st.pyplot
- st.bokeh_chart
- st.altair_chart
- st.altair_chart
- st.vega_lite_chart
- st.plotly_chart
- st.pydeck_chart
- st.graphviz_chart
用户 交互 操作
前面都只是展示文本和数据,streamlit 还能写一些交互界面。平时在网页上、app 上能看到的交互组件,Streamlit 几乎都能支持。。
- button:按钮
- download_button:文件下载
- file_uploader:文件上传
- checkbox:复选框
- radio:单选框
- selectbox:下拉单选框
- multiselect:下拉多选框
- slider:滑动条
- select_slider:选择条
- text_input:文本输入框
- text_area:文本展示框
- number_input:数字输入框,支持加减按钮
- date_input:日期选择框
- time_input:时间选择框
- color_picker:颜色选择器
这些内容非常多,也比较简单,可以直接去看 streamlit 源码里的注释即可。
页面之间数据共享
Session State是Streamlit中用于在不同页面之间传递和保存状态数据的一种机制。通过Session State,我们可以在应用程序的整个生命周期中维护和访问特定于会话的变量。这意味着我们可以在不同页面之间共享和使用相同的变量值,从而实现多页面之间的交互和数据传递。
优点:
- 简单易用:Streamlit的Session State机制使得在不同页面之间传递和保存状态数据变得非常简单。只需使用字典来存储和访问状态数据,无需复杂的配置或额外的库。
- 跨页面数据共享:通过Session State,我们可以在应用程序的整个生命周期中保存和访问特定于会话的变量。这使得在多个页面之间共享数据变得轻松,可以传递复杂的数据结构,如字典、列表等。
- 可扩展性:使用Session State,我们可以轻松地在应用程序中添加新的页面,并在不同页面之间保持数据的一致性。这使得应用程序更易于管理和维护,可以随着需求的增长进行扩展和修改。
- 状态持久化:通过Streamlit的Session State机制,我们可以在刷新应用程序或重新运行应用程序时保留状态数据。这对于用户来说非常方便,他们可以在应用程序的不同会话之间保持他们的工作状态。
缺点:
- 内存消耗:由于Session State数据存储在内存中,当应用程序的状态数据变得庞大时,内存消耗可能会较大。这可能会限制应用程序的可伸缩性和性能。
- 无持久化方案:Session State数据存储在应用程序的内存中,并且仅在应用程序运行期间存在。因此,当应用程序停止运行或重新启动时,Session State数据将丢失。如果需要长期存储数据,需要使用其他机制,如数据库或文件系统。
- 难以调试:由于Session State是在应用程序的多个页面之间传递和共享数据,当出现问题时,追踪和调试可能会比较困难。特别是在复杂的多页面应用程序中,正确地处理和管理Session State变量可能会变得复杂。
多页面
方法 1:通过 pages 文件夹 (推荐)
官网 多页 文档:https://docs.streamlit.io/library/advanced-features/multipage-apps
在单个py文件中,如果每个应用 "页面" 都编写为一个函数,选择框用于选择要显示的页面。随着应用的发展,维护代码需要大量额外的开销。此外,由于受 st.selectbox UI 的限制,无法选择要运行的“页面”,也无法自定义 st.set_page_config 单个页面标题,也无法使用 URL 在页面之间导航。所以,需要将现有应用程序转换为多页应用程序,Streamlit 提供了一种创建多页应用程序的方式。示例:向现有应用添加更多页面:
- 假设您的主脚本名为 main_page.py,在同级目录下创建一个新文件夹 pages,Streamlit 在 pages 文件夹中找到的其他脚本将出现在侧边栏中显示的新页面选择器中。
- 在 pages 文件夹中添加新文件 .py 以向应用添加更多页面 pages。在文件名中添加表情符号时,最佳做法是包含编号前缀。只有
pages/目录中的.py文件才会作为页面加载。Streamlit 忽略pages/目录和子目录中的所有其他文件。页面会自动显示在应用程序侧边栏内漂亮的导航 UI 中。当您单击侧边栏 UI 中的页面时,Streamlit 会导航到该页面,而无需重新加载整个前端。可以在两个 page 之间用 URL进行导航,page通过文件的label来定义有自己的url,当多个页面有相同的label,streamlit会根据排序规则选取第一个。可以通过page的url访问对应的page - 运行 streamlit run main_page.py
多页应用的文档将教你如何向应用添加页面,包括如何定义页面、构建和运行多页应用以及在页面之间导航。了解基础知识后,创建您的第一个多页应用程序!
main.py,在页面显示 main。( 可以改成 Home.py,在页面可以显示 Home )
import sys
import streamlit as st
from streamlit import runtime
from streamlit.web import cli as stcli


def my_web_app():
    st.set_page_config(
        page_title="Hello",
        page_icon="",
    )

    st.write("# Welcome to Streamlit! ")

    st.sidebar.success("Select a demo above.")

    st.markdown(
        """
        Streamlit is an open-source app framework built specifically for
        Machine Learning and Data Science projects.
        ** Select a demo from the sidebar** to see some examples
        of what Streamlit can do!
        ### Want to learn more?
        - Check out [streamlit.io](https://streamlit.io)
        - Jump into our [documentation](https://docs.streamlit.io)
        - Ask a question in our [community
            forums](https://discuss.streamlit.io)
        ### See more complex demos
        - Use a neural net to [analyze the Udacity Self-driving Car Image
            Dataset](https://github.com/streamlit/demo-self-driving)
        - Explore a [New York City rideshare dataset](https://github.com/streamlit/demo-uber-nyc-pickups)
    """
    )


def main():
    if runtime.exists():
        my_web_app()
    else:
        sys.argv = ["streamlit", "run", sys.argv[0]]
        sys.exit(stcli.main())


if __name__ == '__main__':
    main()
创建多个页面
- 可以通过在每个 Python 文件的开头添加数字来更改 MPA 中页面的顺序。如果我们在文件名的前面添加一个 1,Streamlit 会将该文件放在列表中的第一位。
- 每个 Streamlit 应用程序的名称由文件名决定,更改应用程序名称时,需要更改文件名!
- 可以通过在文件名中添加表情符号来为我们的应用程序增添一些乐趣,这些表情符号将在我们的 Streamlit 应用程序中呈现。
- 每个页面都有自己的 URL,由文件名定义。
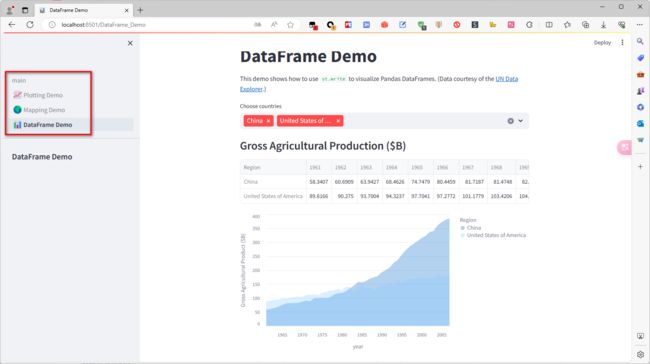
效果如图:
pages/1__Plotting_Demo.py
import streamlit as st
import time
import numpy as np

st.set_page_config(page_title="Plotting Demo", page_icon="")

st.markdown("# Plotting Demo")
st.sidebar.header("Plotting Demo")
st.write(
    """This demo illustrates a combination of plotting and animation with
Streamlit. We're generating a bunch of random numbers in a loop for around
5 seconds. Enjoy!"""
)

progress_bar = st.sidebar.progress(0)
status_text = st.sidebar.empty()
last_rows = np.random.randn(1, 1)
chart = st.line_chart(last_rows)

for i in range(1, 101):
    new_rows = last_rows[-1, :] + np.random.randn(5, 1).cumsum(axis=0)
    status_text.text("%i%% Complete" % i)
    chart.add_rows(new_rows)
    progress_bar.progress(i)
    last_rows = new_rows
    time.sleep(0.05)

progress_bar.empty()

# Streamlit widgets automatically run the script from top to bottom. Since
# this button is not connected to any other logic, it just causes a plain
# rerun.
st.button("Re-run")
pages/2__Mapping_Demo.py
import streamlit as st
import pandas as pd
import pydeck as pdk
from urllib.error import URLError

st.set_page_config(page_title="Mapping Demo", page_icon="")

st.markdown("# Mapping Demo")
st.sidebar.header("Mapping Demo")
st.write(
    """This demo shows how to use
[`st.pydeck_chart`](https://docs.streamlit.io/library/api-reference/charts/st.pydeck_chart)
to display geospatial data."""
)


@st.cache_data
def from_data_file(filename):
    url = (
        "http://raw.githubusercontent.com/streamlit/"
        "example-data/master/hello/v1/%s" % filename
    )
    return pd.read_json(url)


try:
    ALL_LAYERS = {
        "Bike Rentals": pdk.Layer(
            "HexagonLayer",
            data=from_data_file("bike_rental_stats.json"),
            get_position=["lon", "lat"],
            radius=200,
            elevation_scale=4,
            elevation_range=[0, 1000],
            extruded=True,
        ),
        "Bart Stop Exits": pdk.Layer(
            "ScatterplotLayer",
            data=from_data_file("bart_stop_stats.json"),
            get_position=["lon", "lat"],
            get_color=[200, 30, 0, 160],
            get_radius="[exits]",
            radius_scale=0.05,
        ),
        "Bart Stop Names": pdk.Layer(
            "TextLayer",
            data=from_data_file("bart_stop_stats.json"),
            get_position=["lon", "lat"],
            get_text="name",
            get_color=[0, 0, 0, 200],
            get_size=15,
            get_alignment_baseline="'bottom'",
        ),
        "Outbound Flow": pdk.Layer(
            "ArcLayer",
            data=from_data_file("bart_path_stats.json"),
            get_source_position=["lon", "lat"],
            get_target_position=["lon2", "lat2"],
            get_source_color=[200, 30, 0, 160],
            get_target_color=[200, 30, 0, 160],
            auto_highlight=True,
            width_scale=0.0001,
            get_width="outbound",
            width_min_pixels=3,
            width_max_pixels=30,
        ),
    }
    st.sidebar.markdown("### Map Layers")
    selected_layers = [
        layer
        for layer_name, layer in ALL_LAYERS.items()
        if st.sidebar.checkbox(layer_name, True)
    ]
    if selected_layers:
        st.pydeck_chart(
            pdk.Deck(
                map_style="mapbox://styles/mapbox/light-v9",
                initial_view_state={
                    "latitude": 37.76,
                    "longitude": -122.4,
                    "zoom": 11,
                    "pitch": 50,
                },
                layers=selected_layers,
            )
        )
    else:
        st.error("Please choose at least one layer above.")
except URLError as e:
    st.error(
        """
        **This demo requires internet access.**
        Connection error: %s
    """
        % e.reason
    )
pages/3__DataFrame_Demo.py
import streamlit as st
import pandas as pd
import altair as alt
from urllib.error import URLError

st.set_page_config(page_title="DataFrame Demo", page_icon="")

st.markdown("# DataFrame Demo")
st.sidebar.header("DataFrame Demo")
st.write(
    """This demo shows how to use `st.write` to visualize Pandas DataFrames.
(Data courtesy of the [UN Data Explorer](http://data.un.org/Explorer.aspx).)"""
)


@st.cache_data
def get_UN_data():
    AWS_BUCKET_URL = "http://streamlit-demo-data.s3-us-west-2.amazonaws.com"
    df = pd.read_csv(AWS_BUCKET_URL + "/agri.csv.gz")
    return df.set_index("Region")


try:
    df = get_UN_data()
    countries = st.multiselect(
        "Choose countries", list(df.index), ["China", "United States of America"]
    )
    if not countries:
        st.error("Please select at least one country.")
    else:
        data = df.loc[countries]
        data /= 1000000.0
        st.write("### Gross Agricultural Production ($B)", data.sort_index())

        data = data.T.reset_index()
        data = pd.melt(data, id_vars=["index"]).rename(
            columns={"index": "year", "value": "Gross Agricultural Product ($B)"}
        )
        chart = (
            alt.Chart(data)
            .mark_area(opacity=0.3)
            .encode(
                x="year:T",
                y=alt.Y("Gross Agricultural Product ($B):Q", stack=None),
                color="Region:N",
            )
        )
        st.altair_chart(chart, use_container_width=True)
except URLError as e:
    st.error(
        """
        **This demo requires internet access.**
        Connection error: %s
    """
        % e.reason
    )
注意:
- page 支持 magic commands.
- 页面支持保存时运行。此外,当您保存页面时,这会导致当前正在查看该页面的用户重新运行。
- 添加或删除页面会导致 UI 立即更新。
- 更新边栏中的页面不会重新运行脚本。
st.set_page_config在页面级别工作。当您使用st.set_page_config设置标题或图标时,这仅适用于当前页面。- 页面在全局范围内共享相同的 Python 模块:
# page1.py import foo foo.hello = 123 # page2.py import foo st.write(foo.hello) # 如果 page1 已经执行,这里将会输出 123 - 页面共享相同的 st.session_state:
# page1.py
import streamlit as st
if "shared" not in st.session_state:
   st.session_state["shared"] = True

# page2.py
import streamlit as st
st.write(st.session_state["shared"])
# If page1 already executed, this should write True
方法 2:通过函数中的 if else
在使用Session State构建多页面应用之前,让我们先了解一下多页面应用的基本结构。一个典型的多页面应用通常包括以下几个组成部分:
- 导航栏:用于切换页面的导航栏,可以是按钮、链接或下拉菜单等形式。
- 页面内容:不同页面的具体内容和功能模块,可以通过导航栏进行切换。
- 状态管理:保持和管理不同页面之间的状态数据,确保用户在切换页面时数据不会丢失。
import sys
import streamlit as st
from streamlit import runtime
from streamlit.web import cli as stcli


def my_web_app():
    # 设置初始页面为Home
    session_state = st.session_state
    session_state['page'] = 'Home'

    # 导航栏
    page = st.sidebar.radio('Navigate', ['Home', 'About'])

    if page == 'Home':
        st.title('Home Page')
        # 在Home页面中显示数据和功能组件

    elif page == 'About':
        st.title('About Page')
        # 在About页面中显示数据和功能组件


def main():
    if runtime.exists():
        my_web_app()
    else:
        sys.argv = ["streamlit", "run", sys.argv[0]]
        sys.exit(stcli.main())


if __name__ == '__main__':
    main()
方法 3:通过 函数
如果页面内容构建的太过复杂,单纯的 if-else 语句已经无法满足应用的构建需求,这时候可以使用函数来构建。
import sys
import streamlit as st
from streamlit import runtime
from streamlit.web import cli as stcli


def page_home():
    st.title('Home Page')
    # 在Home页面中显示数据和功能组件


def page_about():
    st.title('About Page')
    # 在About页面中显示数据和功能组件


def my_web_app():
    # 设置初始页面为Home
    session_state = st.session_state
    if 'page' not in session_state:
        session_state['page'] = 'Home'
    # 导航栏
    page = st.sidebar.radio('Navigate', ['Home', 'About'])
    if page == 'Home':
        page_home()
    elif page == 'About':
        page_about()


def main():
    if runtime.exists():
        my_web_app()
    else:
        sys.argv = ["streamlit", "run", sys.argv[0]]
        sys.exit(stcli.main())


if __name__ == '__main__':
    main()
组件/控件
如何使用组件,首先找到要使用的组件。两个很好的组件库:
- 组件库:https://streamlit.io/components
- 在这个帖子找 This thread
例如,要使用出色的 AgGrid 组件,首先安装:pip install streamlit-aggrid
from st_aggrid import AgGrid
import pandas as pd

df = pd.read_csv('https://raw.githubusercontent.com/fivethirtyeight/data/master/airline-safety/airline-safety.csv')
AgGrid(df)执行命令:streamlit run example.py
组件 API 参考
- Display almost anything 显示几乎任何东西
- Text elements 文本元素
- Data elements 数据元素
- Chart elements 图表元素
- Input widgets 输入小部件
- Media elements 媒体元素
- Layouts and containers 布局和容器
- Chat elements 聊天元素
- Display progress and status显示进度和状态
- Control flow 控制流
- Developer tools 开发人员工具
- Utilities 公用事业
- Mutate charts 变异图表
- State management 状态管理
- Connections and databases连接和数据库
- Performance 性能
- Connections and databases连接和数据库
- Setup your connection 设置连接
- Built-in connections 内置连接
- Third-party connections 第三方连接
- Personalization 个性化
- App testing 应用测试
高级功能
-
App menu 应用程序菜单
-
Button behavior and examples按钮行为和示例
-
Caching 缓存
-
Command-line options 命令行选项
-
Configuration 配置
-
Theming 主题
-
Connecting to data 连接到数据
-
Dataframes 数据帧
-
Forms 形式
-
Multipage apps 多页应用
-
Add statefulness to apps 为应用添加状态
-
Widget behavior 小组件行为
-
Pre-release features 预发布功能
-
Working with timezones 使用时区
-
Static file serving 静态文件服务
-
HTTPS support HTTPS 支持
-
Secrets management 机密管理
-
Security reminders 安全提醒
-
App testing 应用测试
用户登录
Streamlit-Authenticator:https://github.com/mkhorasani/Streamlit-Authenticator
pypi:https://pypi.org/project/streamlit-authenticator/
一个安全身份验证模块,用于验证 Streamlit 应用程序中的用户凭据。更多使用方法参看 github
import streamlit as st
import streamlit_authenticator as stauth


def login_success():
    container = st.container()
    # create a prompt text for the text generation
    prompt_text = st.text_area(
        label="用户命令输入",
        height=100,
        placeholder="请在这儿输入您的命令"
    )
    # 其他语句...


def main():
    # 用户信息,后续可以来自DB
    names = ['普通用户', '管理员']  # 用户名
    usernames = ['user_king', 'user_admin']  # 登录名
    passwords = ['user_king_passwd', 'user_admin_passwd']  # 登录密码
    # 对密码进行加密操作,后续将这个存放在credentials中
    hashed_passwords = stauth.Hasher(passwords).generate()

    # 定义字典,初始化字典
    credentials = {'usernames': {}}
    # 生成服务器端的用户身份凭证信息
    for i in range(0, len(names)):
        credentials['usernames'][usernames[i]] = {'name': names[i], 'password': hashed_passwords[i]}
    authenticator = stauth.Authenticate(credentials, 'some_cookie_name', 'some_signature_key', cookie_expiry_days=0)
    name, authentication_status, username = authenticator.login('Login', 'main')

    if authentication_status:  # 登录成功
        login_success()
    elif not authentication_status:  # 登录失败
        st.error('Username/password is incorrect')
    elif authentication_status is None:  # 未输入登录信息
        st.warning('Please enter your username and password')


if __name__ == "__main__":
    main()
使用 Streamlit 进行 Web 应用程序开发
多媒体 组件/控件
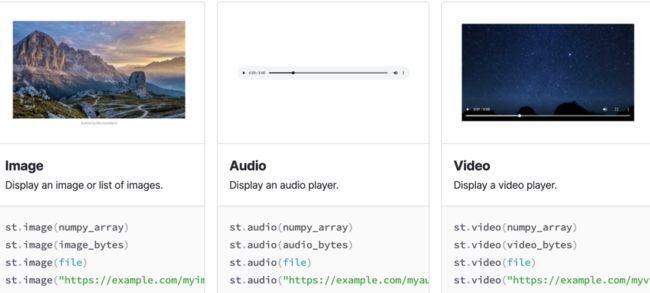
想要在页面上播放图片、音频和视频,可以使用 streamlit 的这三个组件:
- st.image
- st.audio
- st.video
状态 组件
状态组件用来向用户展示当前程序的运行状态,包括:
- progress:进度条,如游戏加载进度
- spinner:等待提示
- balloons:页面底部飘气球,表示祝贺
- error:显示错误信息
- warning:显示报警信息
- info:显示常规信息
- success:显示成功信息
- exception:显示异常信息(代码错误栈)
页面 布局
Streamlit 是自上而下渲染的,组件在页面上的排列顺序与代码的执行顺序一致。一个精美的 web app ,只有上下单栏式的布局肯定是不够的。实际上 streamlit 还提供了多种多样的布局:
st.sidebar:侧边栏。侧边栏可以做一些用户操作控件
- st.columns:列容器,处在同一个 columns 内组件,按照从左至右顺序展示
- st.expander:隐藏信息,点击后可展开展示详细内容,如:展示更多
- st.container:包含多组件的容器
- st.empty:包含单组件的容器
容器:st.sidebar 侧边栏
Streamlit 提供了强大的 st.sidebar 组件。借助于这个组件,可以轻松地将小部件(widgets)放置在应用页面的侧边栏位置。将交互元素添加至侧边栏。可以使用对象表示法(object notation)或者 with 语法将元素添加到 st.sidebar。两者的效果是一样的,只是语法不同。以下是两种添加元素的方式:
# 使用对象表示法
st.sidebar.[element_name]

# "with" 语法
with st.sidebar:
    st.[element_name]
通过将元素添加至 st.sidebar,这些元素会被固定在侧边栏的左侧,让用户可以轻松地浏览和交互。
示例:在侧边栏添加选择框和单选按钮
import streamlit as st

# 使用对象表示法添加选择框
add_selectbox = st.sidebar.selectbox(
    "您希望如何联系您?",
    ("电子邮件", "家庭电话", "移动电话")
)

# 使用“with”语法添加单选按钮
with st.sidebar:
    add_radio = st.radio(
        "选择一种运输方式",
        ("标准(5-15天)", "快递(2-5天)")
)- 侧边栏是可调整大小的!拖放侧边栏的右边框以调整其大小!
- 不支持使用对象表示法的唯一元素是
st.echo、st.spinner和st.toast。若要使用这些元素,必须使用with表示法。
以下是如何在侧边栏中添加 st.echo 和 st.spinner 的示例:
import streamlit as st
import time

with st.sidebar:
    with st.echo():
        st.write("这段代码将在侧边栏中显示。")

    with st.spinner("加载中..."):
        time.sleep(5)
    st.success("完成!")
通过充分利用 st.sidebar,您可以将交互元素整齐地组织在应用的侧边栏,提供更加直观和便捷的用户体验。
容器:st.columns 并排多列
st.columns 返回一个容器对象的列表,可以在这些容器对象中添加元素。每个对象都可以用来添加元素。您可以选择使用“with”语法(更推荐)或者直接在容器对象上调用方法来添加元素。以下是示例代码:
import sys
import streamlit as st
from streamlit import runtime
from streamlit.web import cli as stcli


def layout_column():
    col1, col2, col3 = st.columns(3)

    with col1:
        st.header("一只猫")
        st.image("https://static.streamlit.io/examples/cat.jpg")

    with col2:
        st.header("一只狗")
        st.image("https://static.streamlit.io/examples/dog.jpg")

    with col3:
        st.header("一只猫头鹰")
        st.image("https://static.streamlit.io/examples/owl.jpg")


def main():
    if runtime.exists():
        # layout_sidebar()
        layout_column()
    else:
        sys.argv = ["streamlit", "run", sys.argv[0]]
        sys.exit(stcli.main())


if __name__ == '__main__':
    main()
按百分比设置列大小,在容器对象上调用方法:
import streamlit as st
import numpy as np

col1, col2 = st.columns([3, 1])
data = np.random.randn(10, 1)

col1.subheader("一个宽容器,含有图表")
col1.line_chart(data)

col2.subheader("一个窄容器,含有数据")
col2.write(data)
列不能放在边栏中的其他列中。只能在应用程序的主要区域进行。列只能放置在其他列中,最多嵌套一个级别。也就是说,您可以将多个容器放置在主要内容区域内,但不能将多元素容器嵌套在其他多元素容器内。此外,请注意,不能将多元素容器嵌套在侧边栏的容器内,这只能在应用程序的主要区域中实现。通过合理地运用 st.columns,您可以轻松地实现并排布局的多元素容器,提供更清晰和直观的界面效果,增强用户体验。
容器:st.tabs - 选项卡布局
import sys
import streamlit as st
from streamlit import runtime
from streamlit.web import cli as stcli
import numpy as np


def layout_tab():
    tab1, tab2, tab3, tab4, tab5, tab6 = st.tabs(["猫", "狗", "猫头鹰", "测试多列", "图表", "数据"])
    data = np.random.randn(10, 1)
    with tab1:
        st.header("一只猫")
        st.image("https://static.streamlit.io/examples/cat.jpg", width=200)
    with tab2:
        st.header("一只狗")
        st.image("https://static.streamlit.io/examples/dog.jpg", width=200)
    with tab3:
        st.header("一只猫头鹰")
        st.image("https://static.streamlit.io/examples/owl.jpg", width=200)
    with tab4:
        col1, col2, col3, col4 = st.columns(4)
        col1.header("col1")
        col2.header("col2")
        col3.header("col3")
        col4.header("col4")
    with tab5:
        tab5.subheader("一个带有图表的选项卡")
        tab5.line_chart(data)
    with tab6:
        tab6.subheader("一个带有数据的选项卡")
        tab6.write(data)


def main():
    if runtime.exists():
        # layout_sidebar()
        layout_tab()
    else:
        sys.argv = ["streamlit", "run", sys.argv[0]]
        sys.exit(stcli.main())


if __name__ == '__main__':
    main()
条件渲染的注意事项:需要注意的是,每个选项卡的所有内容都会被一次性发送并渲染在前端,目前不支持条件渲染。这意味着无论用户是否查看某个选项卡,所有内容都会被加载和渲染。在设计应用时,请确保选项卡内的内容在逻辑上是相关的,避免出现不必要的数据传输和渲染。
容器:st.expander 展开/折叠
当内容相对较多时。Streamlit 提供了 st.expander 组件,可以在应用程序中插入一个可展开或折叠的容器,用来承载多个元素。用户可以点击展开或折叠容器,以便在需要时查看更多内容,同时保持界面的整洁性。
通过调用 st.expander,您可以插入一个可展开或折叠的容器,用于包含多个元素。容器的初始状态是折叠的,只显示提供的标签。用户可以点击标签来展开容器,查看其中的内容。同样,您可以选择使用“with”语法或者直接在容器对象上调用方法来添加元素。需要注意的是,目前不支持将 st.expander 嵌套在另一个 st.expander 内。
import streamlit as st

st.bar_chart({"data": [1, 5, 2, 6, 2, 1]})

with st.expander("查看说明"):
    st.write("""
        上面的图表展示了我为您选择的一些数字。
        这些数字是通过真实的骰子摇出来的,所以它们*保证*是随机的。
    """)
    st.image("https://static.streamlit.io/examples/dice.jpg")
也可以直接在容器对象上调用方法:
import streamlit as st

st.bar_chart({"data": [1, 5, 2, 6, 2, 1]})

expander = st.expander("查看说明")
expander.write("""
    上面的图表展示了我为您选择的一些数字。
    这些数字是通过真实的骰子摇出来的,所以它们*保证*是随机的。
""")
expander.image("https://static.streamlit.io/examples/dice.jpg")
目前不支持将 st.expander 嵌套在另一个 st.expander 内。如果需要多层次的展开/折叠功能,您可以使用其他布局组件进行组合。
容器:st.container 插入多元素
通过调用 st.container,您可以插入一个不可见的容器,用于承载多个元素。与之前一样,您可以选择使用“with”语法或者直接在容器对象上调用方法来添加元素。需要注意的是,容器内的内容对用户来说是不可见的,但可以对元素进行管理和组织。
import streamlit as st
import numpy as np

with st.container():
   st.write("这是容器内的内容")

   # 您可以调用任何 Streamlit 命令,包括自定义组件:
   st.bar_chart(np.random.randn(50, 3))

st.write("这是容器外的内容")
无序插入元素:
import streamlit as st

container = st.container(border=True)
container.write("This is inside the container")
st.write("This is outside the container")

# Now insert some more in the container
container.write("This is inside too")
容器:st.empty 插入单元素
在开发应用程序时,有时您可能需要动态地插入、替换或清除单个元素,以实现更灵活的内容展示。Streamlit 提供了 st.empty 组件,可以插入一个单元素容器,用于承载一个元素。这使您可以在任何时候动态地操作单个元素,实现更多样化的界面效果。
通过调用 st.empty,您可以插入一个单元素容器,用于承载一个元素。与之前一样,您可以选择使用“with”语法或者直接在容器对象上调用方法来添加、替换或清除元素。
import streamlit as st
import time

with st.empty():
    for seconds in range(60):
        st.write(f"⏳ 已过去 {seconds} 秒")
        time.sleep(1)
    st.write("✔️ 1 分钟结束!")
替换多个元素,然后清除它们:
import time

import streamlit as st

placeholder = st.empty()

# Replace the placeholder with some text:
placeholder.text("Hello")

# Replace the text with a chart:
placeholder.line_chart({"data": [1, 5, 2, 6]})
time.sleep(5)
# Replace the chart with several elements:
with placeholder.container():
    st.write("This is one element")
    st.write("This is another")

# Clear all those elements:
placeholder.empty()
流程 控制
Streamlit 是自上而下逐步渲染出来的,若你的应用场景需要对渲染做一些控制,streamlit 也有提供对应的方法
- st.stop:可以让 Streamlit 应用停止而不向下执行,如:验证码通过后,再向下运行展示后续内容。
- st.form:表单,Streamlit 在某个组件有交互后就会重新执行页面程序,而有时候需要等一组组件都完成交互后再刷新(如:登录填用户名和密码),这时候就需要将这些组件添加到 form 中
- st.form_submit_button:在 form 中使用,提交表单。
缓存特性提升速度
当用户在页面上做一些操作的时候,比如输入数据,都会触发整个 streamlit 应用代码的重新执行,如果其中有读取外部数据的步骤(数 GB 的数据),那这种性能损耗是非常可怕的。
但 streamlit 提供了一个缓存装饰器,当要重新执行代码渲染页面的时候,就会先去缓存里查一下,如果代码或者数据没有发生变化,就直接调用缓存的结果即可。
使用方法也简单,在需要缓存的函数加上 @st.cache 装饰器即可。
DATE_COLUMN = 'date/time'
DATA_URL = ('https://s3-us-west-2.amazonaws.com/'
            'streamlit-demo-data/uber-raw-data-sep14.csv.gz')

@st.cache
def load_data(nrows):
    data = pd.read_csv(DATA_URL, nrows=nrows)
    lowercase = lambda x: str(x).lower()
    data.rename(lowercase, axis='columns', inplace=True)
    data[DATE_COLUMN] = pd.to_datetime(data[DATE_COLUMN])
    return data
部署并web访问
在本地编写的 streamlit 应用,运行起来后只能在本地访问。如果需要让别人也能访问这个应用,那你需要有一台服务器,这样才能通过公网ip进行访问
3、Streamlit 基础
Streamlit 主要概念
- 开发流程
- 数据流
- 显示和设置数据样式
- 使用 magic
- 写入 数据帧
- 绘制 图表和地图
- 绘制 折线图
- 绘制 地图
- Widgets 组件/控件
- 使用 复选框 显示/隐藏数据
- 使用 选择框
- 布局
- 显示 进度
- 设置 主题
Streamlit 高级概念
- Caching 缓存
- Session State 会话状态
- What is a session? 什么是会话
- Examples of using Session State 使用会话状态的示例
- Connections 连接
Streamlit 其他功能
- Theming 主题
- Pages 页面
- Static file serving 静态文件服务
- App testing 应用测试
高级功能
- Advanced features 高级功能
- ⋮ App menu ⋮应用程序菜单
- Command-line options 命令行选项
- Streamlit configuration Streamlit 配置
- Theming 主题
- Caching 缓存
- Add statefulness to apps为应用添加状态
- Pre-release features 预发布功能
- Secrets management 机密管理
- Working with timezones 使用时区
- Advanced notes on widget behavior有关小部件行为的高级说明
官网 教程
创建应用
- Create your first app创建你的第一个应用
- Fetch some data 获取一些数据
- Effortless caching 轻松缓存
- How's it work? 它是如何工作的?
- Inspect the raw data检查原始数据
- Draw a histogram 绘制直方图
- Plot data on a map在地图上绘制数据
- Filter results with a slider使用滑块筛选结果
- Use a button to toggle data使用按钮切换数据
- Let's put it all together让我们把它们放在一起
- Share your app 共享应用
- Get help 获取帮助
创建多页应用
- Motivation 赋予动机
- Convert an existing app into a multipage app将现有应用转换为多页应用
- Create the entrypoint file创建入口点文件
- Create multiple pages 创建多个页面
- Run the multipage app运行多页应用
- Next steps 后续步骤
知识库
-
Connect to data sources 连接到数据源
-
Deploy Streamlit apps 部署 Streamlit 应用程序
-
Session State basics 会话状态基础知识
-
Build a basic LLM chat app构建基本的 LLM 聊天应用程序
-
Build an LLM app using LangChain使用 LangChain 构建 LLM 应用程序
使用 Streamlit
- Sanity checks 健全性检查
- Batch elements and input widgets with st.form批处理元素和输入小部件 st.form
- How do I run my Streamlit script?如何运行我的 Streamlit 脚本?
- How can I make Streamlit watch for changes in other modules I'm importing in my app?如何让 Streamlit 监视我在应用程序中导入的其他模块的变化?
- What browsers does Streamlit support?Streamlit支持哪些浏览器?
- What is the path of Streamlit’s config.toml file?Streamlit config.toml 的文件路径是什么?
- Where does st.file_uploader store uploaded files and when do they get deleted?st.file_uploader将上传的文件存储在哪里,何时删除?
- How do you retrieve the filename of a file uploaded with st.file_uploader?如何检索使用 st.file_uploader 上传的文件的文件名?
- How to remove "· Streamlit" from the app title?如何删除“·Streamlit“从应用程序标题?
- How to download a file in Streamlit?如何在 Streamlit 中下载文件?
- How to download a Pandas DataFrame as a CSV?如何将 Pandas DataFrame 下载为 CSV?
- How do I get dataframe row-selections from a user?如何从用户那里获取数据帧行选择?
- How can I make st.pydeck_chart use custom Mapbox styles?如何使用 st.pydeck_chart 自定义 Mapbox 样式?
- How to insert elements out of order?如何无序插入元素?
- How to animate elements?如何为元素制作动画?
- Append data to a table or chart将数据追加到表格或图表
- How do I upgrade to the latest version of Streamlit?如何升级到最新版本的 Streamlit?
- Widget updating for every second input when using session state使用会话状态时每秒更新一次小组件
- How do I create an anchor link?如何创建锚链接?
- How do I enable camera access?如何启用相机访问?
- Why does Streamlit restrict nested st.columns?为什么 Streamlit 限制嵌套 st.columns ?
- How to host static files in Streamlit?如何在Streamlit中托管静态文件?
- What is serializable session state?什么是可序列化会话状态?
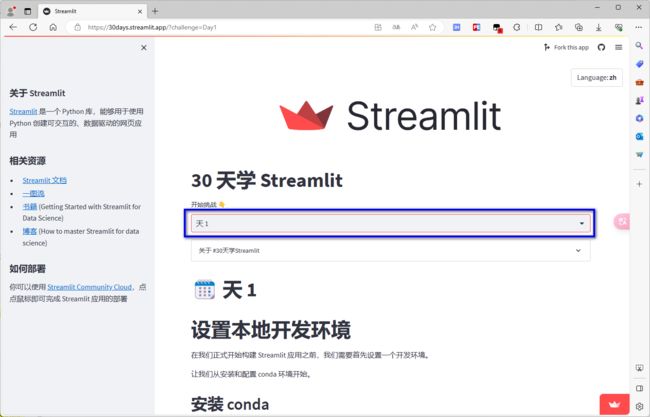
官网 30 天学 Streamlit
:https://30days.streamlit.app/?challenge=Day1
4、低代码 Python Web 框架
官网文档:https://pywebio.readthedocs.io/zh-cn/latest/
PyWebIO提供了一系列命令式的交互函数来在浏览器上获取用户输入和进行输出,将浏览器变成了一个“富文本终端”,可以用于构建简单的Web应用或基于浏览器的GUI应用。 使用PyWebIO,开发者能像编写终端脚本一样(基于input和print进行交互)来编写应用,无需具备HTML和JS的相关知识; PyWebIO还可以方便地整合进现有的Web服务。非常适合快速构建对UI要求不高的应用。
特性
- 使用同步而不是基于回调的方式获取输入,代码编写逻辑更自然
- 非声明式布局,布局方式简单高效
- 代码侵入性小,旧脚本代码仅需修改输入输出逻辑便可改造为Web服务
- 支持整合到现有的Web服务,目前支持与Flask、Django、Tornado、aiohttp、 FastAPI(Starlette)框架集成
- 同时支持基于线程的执行模型和基于协程的执行模型
- 支持结合第三方库实现数据可视化
安装:pip3 install -U pywebio
使用手册
- User’s guide
- 输入
- 输出
- Run application
- More about PyWebIO
- Last but not least
- pywebio.input — 输入模块
- 函数清单
- 函数文档
- pywebio.output — 输出模块
- 函数清单
- 输出域Scope
- 内容输出
- 其他交互
- 布局与样式
- pywebio.session — 会话相关
- pywebio.platform — 应用部署
- Directory Deploy
- Application Deploy
- 其他
- pywebio.pin — 持续性输入
- Overview
- Pin widgets
- Pin utils
- 高级特性
- 使用start_server()启动多应用
- 与Web框架整合
- 基于协程的会话
- 第三方库生态
- 构建stand-alone App
- 数据可视化
- Cookbook
