echarts 折线图根据x轴时间渲染不同颜色的折线
可以使用 lt(小于,less than),gt(大于,greater than),lte(小于等于 less than or equals),gte(大于等于,greater than or equals)来表达边界: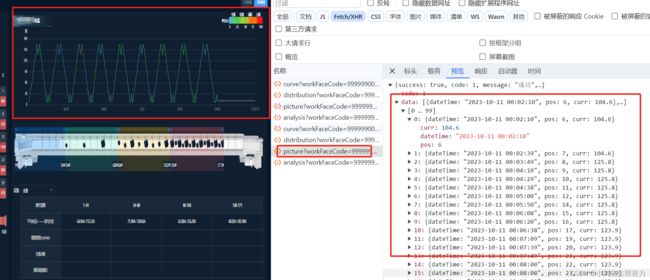
如上图所示一条折线多种颜色
后端数据返回"data": [
{
“dateTime”: “2023-10-11 00:02:10”,
“pos”: 6,
“curr”: 104.6
},
{
“dateTime”: “2023-10-11 00:02:39”,
“pos”: 7,
“curr”: 104.6
}, …]
  我们拿到后端返回的res.data传递给我们的echarts 组件
  进行渲染,数据处理。
  export const pressureLineEcharts = (data, params) => {
	  if (data && data.length > 0) {
	    const color = [
	      '#84909E', '#51B4FF', '#50CF5A', '#FDCC10', '#FF1212'
	    ]
	    let pieces = []
	    data.forEach((item, index) => {
	      const curr = Math.floor(item.curr / 50) > 4 ? 4 : Math.floor(item.curr / 50)
	      if (index < data.length - 1) {
	        pieces.push({
	          gte: window.$moment(item.dateTime).valueOf(),
	          lte: window.$moment(data[index + 1].dateTime).valueOf(),
	          color: item.curr ? color[curr] : '#84909E'
	        })
	      } else {
	        pieces.push({
	          gte: window.$moment(item.dateTime).valueOf(),
	          color: item.curr ? color[curr] : '#84909E'
	        })
	      }
	    })
	    return {
	      tooltip: {
	        trigger: 'axis',
	        formatter: params => {
	          const value = params[0].value
	          return `时间:${value[0]}

当前位置:${value[1]}#

${params[0].seriesName}:${value[2]}A`
	        }
	      },
	      grid: {
	        left: '6%',
	        right: '3%',
	        top: '36',
	        bottom: '36'
	      },
	      xAxis: [
	        {
	          type: 'time',
	          axisPointer: {
	            type: 'shadow'
	          },
	          axisLine: {
	            show: false,
	            lineStyle: {
	              color: '#294259',
	              width: 1,
	              type: 'solid'
	            }
	          },
	          axisLabel: {
	            color: '#838C95',
	            showMaxLabel: true
	          }
	        }
	      ],
	      dataZoom: [
	        {
	          type: 'inside'
	        },
	        {
	          type: 'slider',
	          show: false
	        }
	      ],
	      yAxis: [
	        {
	          name: '架',
	          nameLocation: 'end',
	          nameTextStyle: {
	            color: '#fff',
	            fontSize: 14,
	            padding: [0, 0, 0, -30]
	          },
	          type: 'value',
	          // 横坐标轴线
	          axisLine: {
	            show: false
	          },
	          // 纵坐标,刻度线
	          axisTick: {
	            show: false
	          },
	          // 是否显示横线
	          splitLine: {
	            show: true,
	            lineStyle: {
	              color: '#294259',
	              width: 1,
	              type: 'solid'
	            }
	          },
	          axisLabel: {
	            color: '#fff'
	          }
	        }
	      ],
	      visualMap: [{
	        type: "piecewise",
	        show: false,
	        dimension: 0,
	        // seriesIndex: 0,
	        top: 0,
	        right: 20,
	        textStyle: {
	          color: '#fff'
	        },
	        orient: 'horizontal',
	        pieces
	      }],
	      series: [
	        {
	          name: '刮板运输机机头电流',
	          type: 'line',
	          symbol: 'none',
	          data: data.map(item => [item.dateTime, item.pos, item.curr]),
	          color: '#fff',
	          lineStyle: {
	            width: 1
	          }
	        }
	      ]
	    }
	  } else {
	    return {
	      title: {
	        left: 'center',
	        top: 'center',
	        textStyle: {
	          fontSize: 14
	        },
	        subtext: '暂无数据'
	      }
	    }
	  }
	}

