Android perfetto memory开源工具分析
目录
原理
官网链接
下载heap_profile
producer_support.cc
本地编译
push heapprofd
工具使用
pb文件获取
打开*.pb文件
trace文件
提高系统CPU性能
拆解特定函数内存占用
环境配置
工具使用
修改heap_profile 脚本
原理
Android perfetto memory分析工具和malloc_debug原理类似。
- 基于malloc/free函数族的 caller hook。
- 调用栈运行时聚合,并以每个调用栈为单位进行统计。
- 输出内存信息,申请次数,累计大小
- 支持native进程和Android runtime(APP进程)
- 自适应jemalloc和scudo
malloc_debug原理可以参考以下链接:
https://android.googlesource.com/platform/bionic/+/master/libc/malloc_debug/README.md
官网链接
https://perfetto.dev/
https://www.speedscope.app/
下载heap_profile
工具在Android源码中的位置: external/perfetto/
producer_support.cc
需要修改Android源代码中这个文件:external/perfetto/src/profiling/common/producer_support.cc
producer_support.cc
/*
 * Copyright (C) 2020 The Android Open Source Project
 *
 * Licensed under the Apache License, Version 2.0 (the "License");
 * you may not use this file except in compliance with the License.
 * You may obtain a copy of the License at
 *
 *      http://www.apache.org/licenses/LICENSE-2.0
 *
 * Unless required by applicable law or agreed to in writing, software
 * distributed under the License is distributed on an "AS IS" BASIS,
 * WITHOUT WARRANTIES OR CONDITIONS OF ANY KIND, either express or implied.
 * See the License for the specific language governing permissions and
 * limitations under the License.
 */
#include "src/profiling/common/producer_support.h"
#include "perfetto/ext/base/file_utils.h"
#include "perfetto/ext/base/string_splitter.h"
#include "perfetto/tracing/core/data_source_config.h"
#include "perfetto/tracing/core/forward_decls.h"
#include "src/traced/probes/packages_list/packages_list_parser.h"
#if PERFETTO_BUILDFLAG(PERFETTO_OS_ANDROID)
#include
#endif
namespace perfetto {
namespace profiling {
bool CanProfile(const DataSourceConfig& ds_config,
                uint64_t uid,
                const std::vector& installed_by) {
//Forcely enable
  return true;
// We restrict by !PERFETTO_BUILDFLAG(PERFETTO_ANDROID_BUILD) because a
// sideloaded heapprofd should not be restricted by this. Do note though that,
// at the moment, there isn't really a way to sideload a functioning heapprofd
// onto user builds.
#if !PERFETTO_BUILDFLAG(PERFETTO_ANDROID_BUILD) || \
    !PERFETTO_BUILDFLAG(PERFETTO_OS_ANDROID)
  base::ignore_result(ds_config);
  base::ignore_result(uid);
  base::ignore_result(installed_by);
  return true;
#else
  char buf[PROP_VALUE_MAX + 1] = {};
  int ret = __system_property_get("ro.build.type", buf);
  PERFETTO_CHECK(ret >= 0);
  return CanProfileAndroid(ds_config, uid, installed_by, std::string(buf),
                           "/data/system/packages.list");
#endif
}
bool CanProfileAndroid(const DataSourceConfig& ds_config,
                       uint64_t uid,
                       const std::vector& installed_by,
                       const std::string& build_type,
                       const std::string& packages_list_path) {
  // These are replicated constants from libcutils android_filesystem_config.h
  constexpr auto kAidAppStart = 10000;     // AID_APP_START
  constexpr auto kAidAppEnd = 19999;       // AID_APP_END
  constexpr auto kAidUserOffset = 100000;  // AID_USER_OFFSET
  if (build_type != "user") {
    return true;
  }
  uint64_t uid_without_profile = uid % kAidUserOffset;
  if (uid_without_profile < kAidAppStart || kAidAppEnd < uid_without_profile) {
    // TODO(fmayer): relax this.
    return false;  // no native services on user.
  }
  std::string content;
  if (!base::ReadFile(packages_list_path, &content)) {
    PERFETTO_ELOG("Failed to read %s.", packages_list_path.c_str());
    return false;
  }
  for (base::StringSplitter ss(std::move(content), '\n'); ss.Next();) {
    Package pkg;
    if (!ReadPackagesListLine(ss.cur_token(), &pkg)) {
      PERFETTO_ELOG("Failed to parse packages.list.");
      return false;
    }
    if (pkg.uid != uid_without_profile)
      continue;
    if (!installed_by.empty()) {
      if (pkg.installed_by.empty()) {
        PERFETTO_ELOG(
            "installed_by given in TraceConfig, but cannot parse "
            "installer from packages.list.");
        return false;
      }
      if (std::find(installed_by.cbegin(), installed_by.cend(),
                    pkg.installed_by) == installed_by.cend()) {
        return false;
      }
    }
    switch (ds_config.session_initiator()) {
      case DataSourceConfig::SESSION_INITIATOR_UNSPECIFIED:
        return pkg.profileable_from_shell || pkg.debuggable;
      case DataSourceConfig::SESSION_INITIATOR_TRUSTED_SYSTEM:
        return pkg.profileable || pkg.debuggable;
    }
  }
  // Did not find package.
  return false;
}
}  // namespace profiling
}  // namespace perfetto
本地编译
export BUILD_TARGET_IS=product

source build/envsetup.sh

lunch miproduct_zeus_cn-userdebug

make heapprofd -j5

make完之后会在out/target/product/missi/system/bin目录下生成heapprofd模块
push heapprofd
adb push heapprofd /system/bin
adb shell chmod 777 /system/bin/heapprofd
工具使用
关键点:
python3 tools/heap_profile -n [email protected]_64 --all-heaps -i $sampling_interval -o heap_trace_$DATE关于参数:-i ,默认4KB,采样间隔,如果设置比较大,会出现申请小的trace不会体现,如果设置比较小会出现严重的性能问题,关键看需求。
ps : trace中参数含义 ---- From : Perfetto.Docs.Case Studies.Debugging Memory usage
The tabs that are available are
- space: how many bytes were allocated but not freed at this callstack the moment the dump was created.
- alloc_space: how many bytes were allocated (including ones freed at the moment of the dump) at this callstack
- objects: how many allocations without matching frees were sampled at this callstack.
- alloc_objects: how many allocations (including ones with matching frees) were sampled at this callstack.
pb文件获取
pb文件有两种方式获取:
获取方式一:抓取trace后,文件夹会生成.pb文件
获取方式二:点击trace网页中的Download profile,即可自动生成*.pb
打开*.pb文件
https://www.speedscope.app (将pb文件上传到网页中)
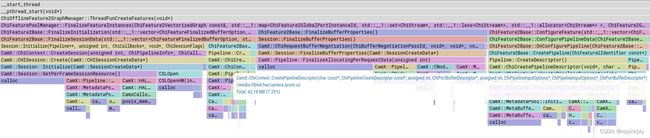
trace文件
通过这个网站打开:https://perfetto.dev/
可以显示每个函数的heap内存占用,这里截个图如下所示:
提高系统CPU性能
因为运行perfetto会导致一定的性能开销,导致手机会比较卡顿,下面命令可以提高CPU性能。
adb shell "echo performance > /sys/devices/system/cpu/cpufreq/policy0/scaling_governor"
adb shell "echo performance > /sys/devices/system/cpu/cpufreq/policy4/scaling_governor"
adb shell "echo performance > /sys/devices/system/cpu/cpufreq/policy6/scaling_governor"
adb shell "echo performance > /sys/devices/system/cpu/cpufreq/policy7/scaling_governor"
手动dump当前heap内存命令:
adb shell killall -USR1 heapprofd
trace右上角dump的pd文件解析网站:
https://www.speedscope.app
拆解特定函数内存占用
环境配置
adb push perfetto /system/bin
adb shell chmod 777 /system/bin/perfetto
adb push heapprofd /system/bin
adb shell chmod 777 /system/bin/heapprofd
工具使用
-f 参数后面设置过滤的函数名,若有多个函数,用,分隔
修改heap_profile 脚本
heap_profile
#!/usr/bin/env python3

# Copyright (C) 2017 The Android Open Source Project
#
# Licensed under the Apache License, Version 2.0 (the "License");
# you may not use this file except in compliance with the License.
# You may obtain a copy of the License at
#
#      http://www.apache.org/licenses/LICENSE-2.0
#
# Unless required by applicable law or agreed to in writing, software
# distributed under the License is distributed on an "AS IS" BASIS,
# WITHOUT WARRANTIES OR CONDITIONS OF ANY KIND, either express or implied.
# See the License for the specific language governing permissions and
# limitations under the License.

from __future__ import absolute_import
from __future__ import division
from __future__ import print_function

import argparse
import atexit
import hashlib
import os
import shutil
import signal
import subprocess
import sys
import tempfile
import time
import uuid
import platform


TRACE_TO_TEXT_SHAS = {
    'linux': '7e3e10dfb324e31723efd63ac25037856e06eba0',
    'mac': '21f0f42dd019b4f09addd404a114fbf2322ca8a4',
}
TRACE_TO_TEXT_PATH = tempfile.gettempdir()
TRACE_TO_TEXT_BASE_URL = ('https://storage.googleapis.com/perfetto/')

NULL = open(os.devnull)
NOOUT = {
    'stdout': NULL,
    'stderr': NULL,
}

UUID = str(uuid.uuid4())[-6:]

def check_hash(file_name, sha_value):
  file_hash = hashlib.sha1()
  with open(file_name, 'rb') as fd:
    while True:
      chunk = fd.read(4096)
      if not chunk:
        break
      file_hash.update(chunk)
    return file_hash.hexdigest() == sha_value


def load_trace_to_text(os_name):
  sha_value = TRACE_TO_TEXT_SHAS[os_name]
  file_name = 'trace_to_text-' + os_name + '-' + sha_value
  local_file = os.path.join(TRACE_TO_TEXT_PATH, file_name)

  if os.path.exists(local_file):
    if not check_hash(local_file, sha_value):
      os.remove(local_file)
    else:
      return local_file

  url = TRACE_TO_TEXT_BASE_URL + file_name
  subprocess.check_call(['curl', '-L', '-#', '-o', local_file, url])
  if not check_hash(local_file, sha_value):
    os.remove(local_file)
    raise ValueError("Invalid signature.")
  os.chmod(local_file, 0o755)
  return local_file


PACKAGES_LIST_CFG = '''data_sources {
  config {
    name: "android.packages_list"
  }
}
'''

CFG_INDENT = '      '
CFG = '''buffers {{
  size_kb: 63488
}}

data_sources {{
  config {{
    name: "android.heapprofd"
    heapprofd_config {{
      shmem_size_bytes: {shmem_size}
      sampling_interval_bytes: {interval}
{target_cfg}
    }}
  }}
}}

duration_ms: {duration}
write_into_file: true
flush_timeout_ms: 30000
flush_period_ms: 604800000
'''

# flush_period_ms of 1 week to suppress trace_processor_shell warning.

CONTINUOUS_DUMP = """
      continuous_dump_config {{
        dump_phase_ms: 0
        dump_interval_ms: {dump_interval}
      }}
"""

PROFILE_LOCAL_PATH = os.path.join(tempfile.gettempdir(), UUID)

IS_INTERRUPTED = False

def sigint_handler(sig, frame):
  global IS_INTERRUPTED
  IS_INTERRUPTED = True


def print_no_profile_error():
  print("No profiles generated", file=sys.stderr)
  print(
    "If this is unexpected, check "
    "https://perfetto.dev/docs/data-sources/native-heap-profiler#troubleshooting.",
    file=sys.stderr)

def known_issues_url(number):
  return ('https://perfetto.dev/docs/data-sources/native-heap-profiler'
          '#known-issues-android{}'.format(number))

KNOWN_ISSUES = {
  '10': known_issues_url(10),
  'Q': known_issues_url(10),
  '11': known_issues_url(11),
  'R': known_issues_url(11),
}

def maybe_known_issues():
  release_or_codename = subprocess.check_output(
    ['adb', 'shell', 'getprop', 'ro.build.version.release_or_codename']
  ).decode('utf-8').strip()
  return KNOWN_ISSUES.get(release_or_codename, None)

SDK = {
    'R': 30,
}

def release_or_newer(release):
  sdk = int(subprocess.check_output(
    ['adb', 'shell', 'getprop', 'ro.system.build.version.sdk']
  ).decode('utf-8').strip())
  if sdk >= SDK[release]:
    return True
  codename = subprocess.check_output(
    ['adb', 'shell', 'getprop', 'ro.build.version.codename']
  ).decode('utf-8').strip()
  return codename == release

def main(argv):
  parser = argparse.ArgumentParser()
  parser.add_argument(
      "-i",
      "--interval",
      help="Sampling interval. "
      "Default 4096 (4KiB)",
      type=int,
      default=4096)
  parser.add_argument(
      "-d",
      "--duration",
      help="Duration of profile (ms). 0 to run until interrupted. "
      "Default: until interrupted by user.",
      type=int,
      default=0)
  # This flag is a no-op now. We never start heapprofd explicitly using system
  # properties.
  parser.add_argument(
      "--no-start", help="Do not start heapprofd.", action='store_true')
  parser.add_argument(
      "-p",
      "--pid",
      help="Comma-separated list of PIDs to "
      "profile.",
      metavar="PIDS")
  parser.add_argument(
      "-n",
      "--name",
      help="Comma-separated list of process "
      "names to profile.",
      metavar="NAMES")
  parser.add_argument(
      "-f",
      "--functions",
      help="Comma-separated list of functions "
      "names to profile.",
      metavar="FUNCTIONS")
  parser.add_argument(
      "-c",
      "--continuous-dump",
      help="Dump interval in ms. 0 to disable continuous dump.",
      type=int,
      default=0)
  parser.add_argument(
      "--heaps",
      help="Comma-separated list of heaps to collect, e.g: malloc,art. "
      "Requires Android 12.",
      metavar="HEAPS")
  parser.add_argument(
      "--all-heaps",
      action="store_true",
      help="Collect allocations from all heaps registered by target."
  )
  parser.add_argument(
      "--no-android-tree-symbolization",
      action="store_true",
      help="Do not symbolize using currently lunched target in the "
      "Android tree."
  )
  parser.add_argument(
      "--disable-selinux",
      action="store_true",
      help="Disable SELinux enforcement for duration of "
      "profile.")
  parser.add_argument(
      "--no-versions",
      action="store_true",
      help="Do not get version information about APKs.")
  parser.add_argument(
      "--no-running",
      action="store_true",
      help="Do not target already running processes. Requires Android 11.")
  parser.add_argument(
      "--no-startup",
      action="store_true",
      help="Do not target processes that start during "
      "the profile. Requires Android 11.")
  parser.add_argument(
      "--shmem-size",
      help="Size of buffer between client and "
      "heapprofd. Default 8MiB. Needs to be a power of two "
      "multiple of 4096, at least 8192.",
      type=int,
      default=8 * 1048576)
  parser.add_argument(
      "--block-client",
      help="When buffer is full, block the "
      "client to wait for buffer space. Use with caution as "
      "this can significantly slow down the client. "
      "This is the default",
      action="store_true")
  parser.add_argument(
      "--block-client-timeout",
      help="If --block-client is given, do not block any allocation for "
      "longer than this timeout (us).",
      type=int)
  parser.add_argument(
      "--no-block-client",
      help="When buffer is full, stop the "
      "profile early.",
      action="store_true")
  parser.add_argument(
      "--idle-allocations",
      help="Keep track of how many "
      "bytes were unused since the last dump, per "
      "callstack",
      action="store_true")
  parser.add_argument(
      "--dump-at-max",
      help="Dump the maximum memory usage "
      "rather than at the time of the dump.",
      action="store_true")
  parser.add_argument(
      "--disable-fork-teardown",
      help="Do not tear down client in forks. This can be useful for programs "
      "that use vfork. Android 11+ only.",
      action="store_true")
  parser.add_argument(
      "--simpleperf",
      action="store_true",
      help="Get simpleperf profile of heapprofd. This is "
      "only for heapprofd development.")
  parser.add_argument(
      "--trace-to-text-binary",
      help="Path to local trace to text. For debugging.")
  parser.add_argument(
      "--print-config",
      action="store_true",
      help="Print config instead of running. For debugging.")
  parser.add_argument(
      "-o",
      "--output",
      help="Output directory.",
      metavar="DIRECTORY",
      default=None)

  args = parser.parse_args()
  fail = False
  if args.block_client and args.no_block_client:
    print(
        "FATAL: Both block-client and no-block-client given.", file=sys.stderr)
    fail = True
  if args.pid is None and args.name is None:
    print("FATAL: Neither PID nor NAME given.", file=sys.stderr)
    fail = True
  if args.duration is None:
    print("FATAL: No duration given.", file=sys.stderr)
    fail = True
  if args.interval is None:
    print("FATAL: No interval given.", file=sys.stderr)
    fail = True
  if args.shmem_size % 4096:
    print("FATAL: shmem-size is not a multiple of 4096.", file=sys.stderr)
    fail = True
  if args.shmem_size < 8192:
    print("FATAL: shmem-size is less than 8192.", file=sys.stderr)
    fail = True
  if args.shmem_size & (args.shmem_size - 1):
    print("FATAL: shmem-size is not a power of two.", file=sys.stderr)
    fail = True

  target_cfg = ""
  if not args.no_block_client:
    target_cfg += CFG_INDENT + "block_client: true\n"
  if args.block_client_timeout:
    target_cfg += (
      CFG_INDENT + "block_client_timeout_us: %s\n" % args.block_client_timeout
    )
  if args.no_startup:
    target_cfg += CFG_INDENT + "no_startup: true\n"
  if args.no_running:
    target_cfg += CFG_INDENT + "no_running: true\n"
  if args.dump_at_max:
    target_cfg += CFG_INDENT + "dump_at_max: true\n"
  if args.disable_fork_teardown:
    target_cfg += CFG_INDENT + "disable_fork_teardown: true\n"
  if args.all_heaps:
    target_cfg += CFG_INDENT + "all_heaps: true\n"
  if args.pid:
    for pid in args.pid.split(','):
      try:
        pid = int(pid)
      except ValueError:
        print("FATAL: invalid PID %s" % pid, file=sys.stderr)
        fail = True
      target_cfg += CFG_INDENT + 'pid: {}\n'.format(pid)
  if args.name:
    for name in args.name.split(','):
      target_cfg += CFG_INDENT + 'process_cmdline: "{}"\n'.format(name)
  if args.heaps:
    for heap in args.heaps.split(','):
      target_cfg += CFG_INDENT + 'heaps: "{}"\n'.format(heap)
  if args.functions:
    for functions in args.functions.split(','):
      target_cfg += CFG_INDENT + 'function_names: "{}"\n'.format(functions)

  if fail:
    parser.print_help()
    return 1

  trace_to_text_binary = args.trace_to_text_binary

  if args.continuous_dump:
    target_cfg += CONTINUOUS_DUMP.format(dump_interval=args.continuous_dump)
  cfg = CFG.format(
      interval=args.interval,
      duration=args.duration,
      target_cfg=target_cfg,
      shmem_size=args.shmem_size)
  if not args.no_versions:
    cfg += PACKAGES_LIST_CFG

  if args.print_config:
    print(cfg)
    return 0

  # Do this AFTER print_config so we do not download trace_to_text only to
  # print out the config.
  has_trace_to_text = True
  if trace_to_text_binary is None:
    os_name = None
    if sys.platform.startswith('linux'):
      os_name = 'linux'
    elif sys.platform.startswith('darwin'):
      os_name = 'mac'
    elif sys.platform.startswith('win32'):
      has_trace_to_text = False
    else:
      print("Invalid platform: {}".format(sys.platform), file=sys.stderr)
      return 1

    arch = platform.machine()
    if arch not in ['x86_64', 'amd64']:
      has_trace_to_text = False

    if has_trace_to_text:
      trace_to_text_binary = load_trace_to_text(os_name)

  known_issues = maybe_known_issues()
  if known_issues:
    print('If you are experiencing problems, please see the known issues for '
          'your release: {}.'.format(known_issues))

  # TODO(fmayer): Maybe feature detect whether we can remove traces instead of
  # this.
  uuid_trace = release_or_newer('R')
  if uuid_trace:
    profile_device_path = '/data/misc/perfetto-traces/profile-' + UUID
  else:
    user = subprocess.check_output(
      ['adb', 'shell', 'whoami']).decode('utf-8').strip()
    profile_device_path = '/data/misc/perfetto-traces/profile-' + user

  perfetto_cmd = ('CFG=\'{cfg}\'; echo ${{CFG}} | '
                  'perfetto --txt -c - -o ' + profile_device_path + ' -d')

  if args.disable_selinux:
    enforcing = subprocess.check_output(['adb', 'shell', 'getenforce'])
    atexit.register(
        subprocess.check_call,
        ['adb', 'shell', 'su root setenforce %s' % enforcing])
    subprocess.check_call(['adb', 'shell', 'su root setenforce 0'])

  if args.simpleperf:
    subprocess.check_call([
        'adb', 'shell', 'mkdir -p /data/local/tmp/heapprofd_profile && '
        'cd /data/local/tmp/heapprofd_profile &&'
        '(nohup simpleperf record -g -p $(pidof heapprofd) 2>&1 &) '
        '> /dev/null'
    ])

  profile_target = PROFILE_LOCAL_PATH
  if args.output is not None:
    profile_target = args.output
  else:
    os.mkdir(profile_target)

  if not os.path.isdir(profile_target):
    print("Output directory {} not found".format(profile_target),
            file=sys.stderr)
    return 1

  if os.listdir(profile_target):
    print("Output directory {} not empty".format(profile_target),
            file=sys.stderr)
    return 1

  perfetto_pid = subprocess.check_output(
      ['adb', 'exec-out',
       perfetto_cmd.format(cfg=cfg)]).strip()
  try:
    perfetto_pid = int(perfetto_pid.strip())
  except ValueError:
    print("Failed to invoke perfetto: {}".format(perfetto_pid), file=sys.stderr)
    return 1

  old_handler = signal.signal(signal.SIGINT, sigint_handler)
  print("Profiling active. Press Ctrl+C to terminate.")
  print("You may disconnect your device.")
  print()
  exists = True
  device_connected = True
  while not device_connected or (exists and not IS_INTERRUPTED):
    exists = subprocess.call(
        ['adb', 'shell', '[ -d /proc/{} ]'.format(perfetto_pid)], **NOOUT) == 0
    device_connected = subprocess.call(['adb', 'shell', 'true'], **NOOUT) == 0
    time.sleep(1)
  print("Waiting for profiler shutdown...")
  signal.signal(signal.SIGINT, old_handler)
  if IS_INTERRUPTED:
    # Not check_call because it could have existed in the meantime.
    subprocess.call(['adb', 'shell', 'kill', '-INT', str(perfetto_pid)])
  if args.simpleperf:
    subprocess.check_call(['adb', 'shell', 'killall', '-INT', 'simpleperf'])
    print("Waiting for simpleperf to exit.")
    while subprocess.call(
        ['adb', 'shell', '[ -f /proc/$(pidof simpleperf)/exe ]'], **NOOUT) == 0:
      time.sleep(1)
    subprocess.check_call(
        ['adb', 'pull', '/data/local/tmp/heapprofd_profile', profile_target])
    print(
      "Pulled simpleperf profile to " + profile_target + "/heapprofd_profile")

  # Wait for perfetto cmd to return.
  while exists:
    exists = subprocess.call(
        ['adb', 'shell', '[ -d /proc/{} ]'.format(perfetto_pid)]) == 0
    time.sleep(1)

  profile_host_path = os.path.join(profile_target, 'raw-trace')
  subprocess.check_call(
    ['adb', 'pull', profile_device_path, profile_host_path], stdout=NULL)
  if uuid_trace:
    subprocess.check_call(
          ['adb', 'shell', 'rm', profile_device_path], stdout=NULL)

  if not has_trace_to_text:
    print('Wrote profile to {}'.format(profile_host_path))
    print('This file can be opened using the Perfetto UI, https://ui.perfetto.dev')
    return 0

  binary_path = os.getenv('PERFETTO_BINARY_PATH')
  if not args.no_android_tree_symbolization:
    product_out = os.getenv('ANDROID_PRODUCT_OUT')
    if product_out:
      product_out_symbols = product_out + '/symbols'
    else:
      product_out_symbols = None

    if binary_path is None:
      binary_path = product_out_symbols
    elif product_out_symbols is not None:
      binary_path += ":" + product_out_symbols

  trace_file = os.path.join(profile_target, 'raw-trace')
  concat_files = [trace_file]

  if binary_path is not None:
    with open(os.path.join(profile_target, 'symbols'), 'w') as fd:
      ret = subprocess.call([
          trace_to_text_binary, 'symbolize',
          os.path.join(profile_target, 'raw-trace')],
          env=dict(os.environ, PERFETTO_BINARY_PATH=binary_path),
          stdout=fd)
    if ret == 0:
      concat_files.append(os.path.join(profile_target, 'symbols'))
    else:
      print("Failed to symbolize. Continuing without symbols.",
      file=sys.stderr)

  proguard_map = os.getenv('PERFETTO_PROGUARD_MAP')
  if proguard_map is not None:
    with open(os.path.join(profile_target, 'deobfuscation-packets'), 'w') as fd:
      ret = subprocess.call([
          trace_to_text_binary, 'deobfuscate',
          os.path.join(profile_target, 'raw-trace')],
          env=dict(os.environ, PERFETTO_PROGUARD_MAP=proguard_map),
          stdout=fd)
    if ret == 0:
      concat_files.append(
        os.path.join(profile_target, 'deobfuscation-packets'))
    else:
      print("Failed to deobfuscate. Continuing without deobfuscated.",
      file=sys.stderr)

  if len(concat_files) > 1:
    with open(os.path.join(profile_target, 'symbolized-trace'), 'wb') as out:
      for fn in concat_files:
        with open(fn, 'rb') as inp:
          while True:
            buf = inp.read(4096)
            if not buf:
              break
            out.write(buf)
    trace_file = os.path.join(profile_target, 'symbolized-trace')

  trace_to_text_output = subprocess.check_output(
      [trace_to_text_binary, 'profile', trace_file])
  profile_path = None
  for word in trace_to_text_output.decode('utf-8').split():
    if 'heap_profile-' in word:
      profile_path = word
  if profile_path is None:
    print_no_profile_error()
    return 1

  profile_files = os.listdir(profile_path)
  if not profile_files:
    print_no_profile_error()
    return 1

  for profile_file in profile_files:
    shutil.copy(os.path.join(profile_path, profile_file), profile_target)

  subprocess.check_call(
      ['gzip'] +
      [os.path.join(profile_target, x) for x in profile_files])

  symlink_path = None
  if args.output is None:
    symlink_path = os.path.join(
      os.path.dirname(profile_target), "heap_profile-latest")
    if os.path.lexists(symlink_path):
      os.unlink(symlink_path)
    os.symlink(profile_target, symlink_path)

  if symlink_path is not None:
    print("Wrote profiles to {} (symlink {})".format(
        profile_target, symlink_path))
  else:
    print("Wrote profiles to {}".format(profile_target))

  print("These can be viewed using pprof. Googlers: head to pprof/ and "
        "upload them.")


if __name__ == '__main__':
  sys.exit(main(sys.argv))
运行脚本
#!/bin/bash

pid_app=$(adb shell ps | grep com.android.camera | awk '{print $2}')
pid_server=$(adb shell ps | grep -Eia "cameraserver$" | awk '{print $2}')
pid_provider=$(adb shell ps | grep camera.provider | awk '{print $2}')

pid_allocate=$(adb shell ps | grep vendor.qti.hardware.display.allocator-service | awk '{print $2}')
pid_hidl=$(adb shell ps | grep [email protected] | awk '{print $2}')

adb shell "echo performance > /sys/devices/system/cpu/cpufreq/policy0/scaling_governor"
#adb shell "echo performance > /sys/devices/system/cpu/cpufreq/policy4/scaling_governor"
#adb shell "echo performance > /sys/devices/system/cpu/cpufreq/policy6/scaling_governor"
adb shell "echo performance > /sys/devices/system/cpu/cpufreq/policy7/scaling_governor"
adb shell "echo performance > /sys/devices/system/cpu/cpufreq/policy3/scaling_governor"

DATE=$(date "+%m_%d_%H_%M_%S")
sampling_interval=6000

mkdir heap_trace_$DATE
#python3 tools/heap_profile -n vendor.qti.camera.provider-service_64 -f process_capture_request --all-heaps -i $sampling_interval  -o heap_trace_$DATE
python3 tools/heap_profile -n vendor.qti.camera.provider-service_64 -f configure_streams,process_capture_request --all-heaps -i $sampling_interval  -o heap_trace_$DATE
#python3 tools/heap_profile  -p $pid_provider  -i 0 -o heap_trace_$DATE
#--trace-to-text-binary  heap_trace_$DATE
gzip -d heap_trace_$DATE/*.gz

echo "Output directory is heap_trace_$DATE"