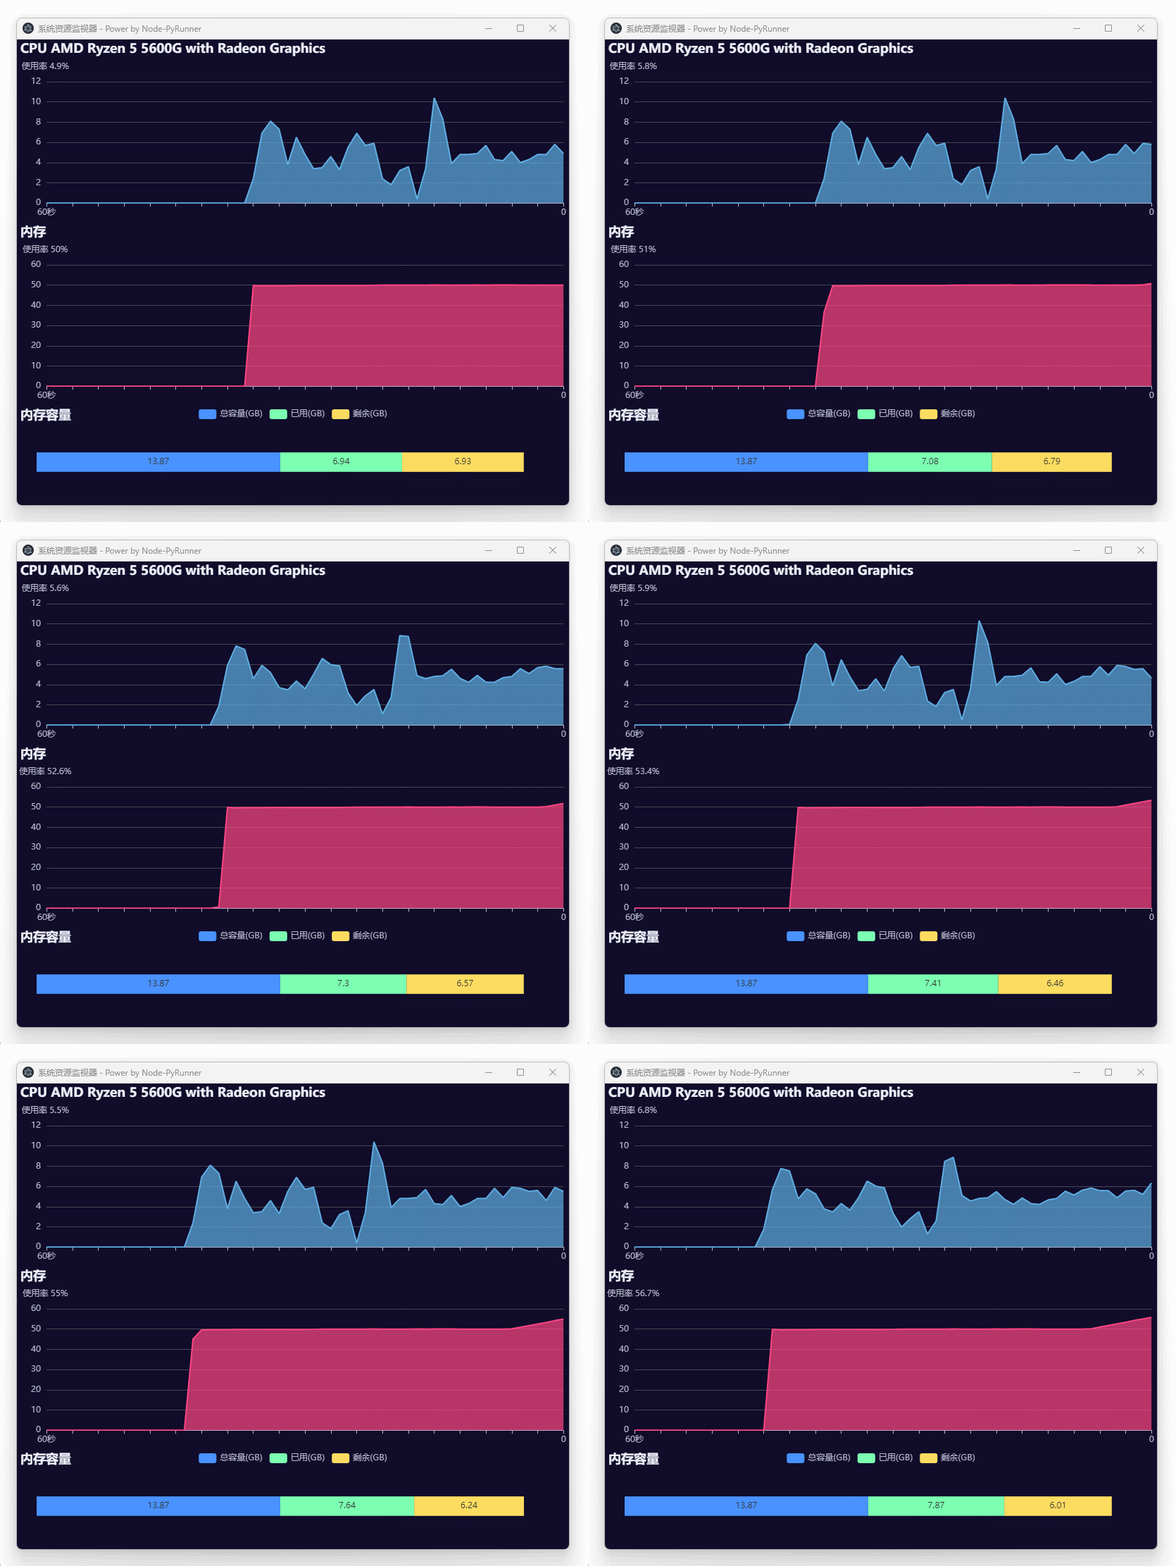
Python图形界面开发——系统资源监视器System-Monitor
Python图形界面程序怎么开发呢?很多人推荐python自带的tkinter自带库,还有pyqt这个这种拖拽式界面开发方案,但是他们开发界面比较难定制界面样式。现在web前端这么多框架用来开发python的图形界面其实不是很好?下面这么案例就是用electron作为python的图形界面,通过node-pyrunner实现与python交互,把web前端繁荣的生态融合进python的生态,引入electron意味着可以用bootstrap或者vuejs、react等等优秀的前端框架进行界面开发,后端用python丰富的第三方库进行开发。
系统资源监视器system-monitor是基于Electron创建并使用node-pyrunner执行python的应用,实现了CPU、内存等系统资源使用的监视。Python部分主要用第三方库psutil获取系统CPU和内存等硬件使用情况,最终在Electron中通过echarts呈现数据。
项目目录
system-monitor:.
│  echarts.min.js	#echarts图表
│  index.html		#electron页面
│  index.js			#node入口文件
│  package.json		#npm项目配置文件
│  python3.dll		#python解释器动态库
│  python310.dll	#python解释器动态库
│  README.md
│  renderer.js		#index.html页面JS脚本文件
│  styles.css
│
├─pyscript
│  │  app.py	#python脚本
│  │
│  └─venv
│      └─Lib
│          └─site-packages	#python虚拟环境第三方pip包目录
│
└─python	#python解释器目录
克隆项目
你需要Git工具和Node.js (包含npm)克隆到本地才能运行,执行以下命令:
# 克隆仓库
git clone https://github.com/supercoderlee/system-monitor.git
# 进入目录
cd system-monitor
# 安装依赖
npm install
安装psutil模块
安装python在当前项目下执行命令创建虚拟环境
python -m venv pyscript/venv
使用虚拟环境的目的是方便打包发布应用时包含python模块。
激活虚拟环境
pyscript/venv/Scripts/activate
安装psutil模块
pip install psutil
启动应用
npm start
Python代码
python部分时启动两个线程每秒读取CPU和内存占用信息,然后再python中调用JavaScript的函数实现动态更新echarts图表数据。
app.py
import nodepyrunner
import threading
import time
import psutil
import winreg
import json

# 获取CPU信息
def cpu_info():
    # 注册表读取CPU名称
    key = winreg.OpenKey(winreg.HKEY_LOCAL_MACHINE, r"HARDWARE\DESCRIPTION\System\CentralProcessor\0")
    cpu_name = winreg.QueryValueEx(key, "ProcessorNameString")
    key.Close()
    # CPU使用信息
    data = dict(
        cpu_name=cpu_name[0],
        cpu_avg=psutil.cpu_percent(interval=0, percpu=False),  # cpu平均使用率
        per_cpu_avg=psutil.cpu_percent(interval=0, percpu=True),  # 每个cpu使用率
        cpu_core=psutil.cpu_count(False),  # cpu物理核心数量
        cpu_logic=psutil.cpu_count(True)  # cpu逻辑核心数量
    )
    return data

# CPU监视线程
def cpu_monitor():
    while(True):
        time.sleep(1)
        data = cpu_info()
        j_str = json.dumps(data)
        #调用JS函数更新图表数据
        nodepyrunner.callJs(target='UpdateCPU', args=[j_str])

def start():
    t_cpu = threading.Thread(target=cpu_monitor, args=())
    t_cpu.start()
JavaScript代码
index.html
DOCTYPE html>
<html>
  <head>
    <meta charset="UTF-8">

    <meta http-equiv="Content-Security-Policy" content="default-src 'self'; script-src 'self'; style-src 'self' 'unsafe-inline'">
    <link href="./styles.css" rel="stylesheet">

    <script src="echarts.min.js">script>
    <title>系统资源监视器 - Power by Node-PyRunnertitle>
  head>
  <body>

    <div id="cpu-percent-chart" style="width: 100%;height:260px;">div>

    <script src="./renderer.js">script>
  body>
html>
renderer.js
/
// echarts部分
/

/* 添加初始数据 */
let cpuData = [];
let xAxisData = [];
for (let index = 60; index > -1; index--) {
    let str = (index == 60) ? '60秒' : (index == 0) ? '0' : '';
    xAxisData.push(str); //X轴只添加第一个和最后一个项目
    cpuData.push(0); //添加60个0到数组,因为监视CPU图表从右侧更新数据
}

/* CPU */
var cpuPercentChart = echarts.init(document.getElementById('cpu-percent-chart'));
cpuPercentOption = {
    title: {
        text: 'CPU'
    },
    grid: {
        left: '20',
        right: '1%',
        bottom: '3%',
        containLabel: true
    },
    xAxis: {
        type: 'category',
        boundaryGap: false,
        data: xAxisData
    },
    yAxis: {
        name: '使用率',
        type: 'value',
        // position: 'right'
    },
    series: [
        {
            name: 'Fake Data',
            type: 'line',
            symbol: 'none',
            sampling: 'lttb',
            itemStyle: {
                color: 'rgb(95,174,227)'
            },
            areaStyle: {
                color: new echarts.graphic.LinearGradient(0, 0, 0, 1, [
                    {
                        offset: 0,
                        color: 'rgb(255, 158, 68)'
                    },
                    {
                        offset: 1,
                        color: 'rgb(255, 70, 131)'
                    }
                ])
            },
            data: cpuData,
            type: 'line',
            areaStyle: {}
        }
    ]
};
cpuPercentChart.setOption(cpuPercentOption);

/* 监听改变窗体尺寸事件自适应图表 */
window.addEventListener('resize', function () {
    cpuPercentChart.resize();
});

/
// node-pyrunner执行python部分
/

const pyrunner = require('node-pyrunner')
pyrunner.config['module_search_paths'].push('./pyscript');
pyrunner.init();
let appModule = pyrunner.import('app');
appModule.callSync('start', []); //启动python监视线程

/* python调用函数更新CPU */
UpdateCPU = (jsonStr) => {
    let obj = JSON.parse(jsonStr);
    cpuPercentOption['title']['text'] = `CPU ${obj.cpu_name}`; // 更新标题
    cpuPercentOption['yAxis']['name'] = `使用率 ${obj.cpu_avg}% `; // 更新Y轴名称
    // 更新数据
    let chartdata = cpuPercentOption['series'][0]['data'];
    chartdata.push(obj.cpu_avg);
    chartdata.shift();
    cpuPercentChart.setOption(cpuPercentOption);
}
学习资料
- electronjs.org/docs - Electron所有文档
- Electron Fiddle - 测试Electron的实验。
- node-pyrunner/docs - Node-PyRunner文档
