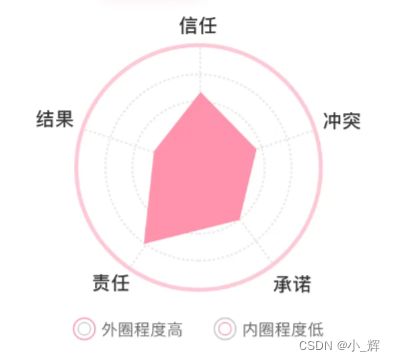
小程序中使用echarts实现带边框雷达图
我们项目需要实现一个带边框的雷达图,看了API之后没有发现怎么去实现这个边框,所以想到了画两个雷达图来实现这个边框,具体效果如上,代码如下
  // 初始化雷达图
  init() {
    let { optionsValue } = this.data;
    function bar(canvas, width, height, dpr) {
      const chart = echarts.init(canvas, null, {
        width: width,
        height: height,
        devicePixelRatio: dpr,
      });
      canvas.setChart(chart);
      let option = {
        title: {
          text: "自定义雷达图",
        },

        radar: [
          {
            indicator: [
              { text: "信任", max: 5 },
              { text: "冲突", max: 5 },
              { text: "承诺", max: 5 },
              { text: "责任", max: 5 },
              { text: "结果", max: 5 },
            ],
            center: ["50%", "50%"],
            radius: 110,
            startAngle: 90,
            splitNumber: 4,
            shape: "circle",
            name: {
              formatter: "{value}",
              textStyle: {
                color: "#333333",
              },
            },
            // 设置区域边框和区域的颜色
            itemStyle: {
              normal: {
                color: "#FF92AC",
                lineStyle: {
                  color: "#FF92AC",
                },
              },
            },
            splitArea: {
              areaStyle: {
                color: "#fff",
                shadowColor: "rgba(0, 0, 0, 0.3)",
                // shadowBlur: 10,
              },
            },
            axisLine: {
              lineStyle: {
                color: "#E9E9E9",
                type: "dashed",
              },
            },
            splitLine: {
              lineStyle: {
                color: "#E9E9E9",
                type: "dashed",
              },
            },
          },
          {
            indicator: [
              {
                max: 100,
              },
              {
                max: 100,
              },
              {
                max: 100,
              },
              {
                max: 100,
              },
              {
                max: 100,
              },
            ],

            center: ["50%", "50%"],
            radius: 111,
            startAngle: 90,
            splitNumber: 1,
            shape: "circle",
            splitArea: {
              show: false,
            },
            axisLine: {
              show: false,
            },
            splitLine: {
              lineStyle: {
                color: "#FF92AC",
                type: "solid",
                width: 2,
              },
            },
          },
        ],
        series: [
          {
            name: "雷达图",
            type: "radar",
            silent: false,
            emphasis: {
              lineStyle: {
                width: 4,
              },
            },

            symbolSize: 0,

            data: [
              {
                value: optionsValue,
                name: "图一",
                symbol: "rect",
                areaStyle: {
                  color: "#FF92AC",
                },
                itemStyle: {
                  normal: {
                    color: "#FF92AC",
                    lineStyle: {
                      color: "#FF92AC",
                    },
                  },
                },
              },
            ],
          },
        ],
      };
      chart.setOption(option);
      return chart;
    }
    let str = "ec.onInit.br";
    let ec = { onInit: bar };
    this.setData({
      ec,
    });
  },
通过第二个雷达图跟第一个雷达图同心圆,半径比实际展示的大一点,splitNumber:1来实现一个只有外边框的雷达图
