CVPR 2023 Hybrid Tutorial: All Things ViTs之mean attention distance (MAD)
All Things ViTs系列讲座从ViT视觉模型注意力机制出发,本文给出mean attention distance可视化部分阅读学习体会.
课程视频与课件: https://all-things-vits.github.io/atv/
代码: https://colab.research.google.com/github/all-things-vits/code-samples/blob/main/probing/mean_attention_distance.ipynb
文献:A N I MAGE IS W ORTH 16 X 16 W ORDS :
T RANSFORMERS FOR I MAGE R ECOGNITION AT S CALE
1.总述
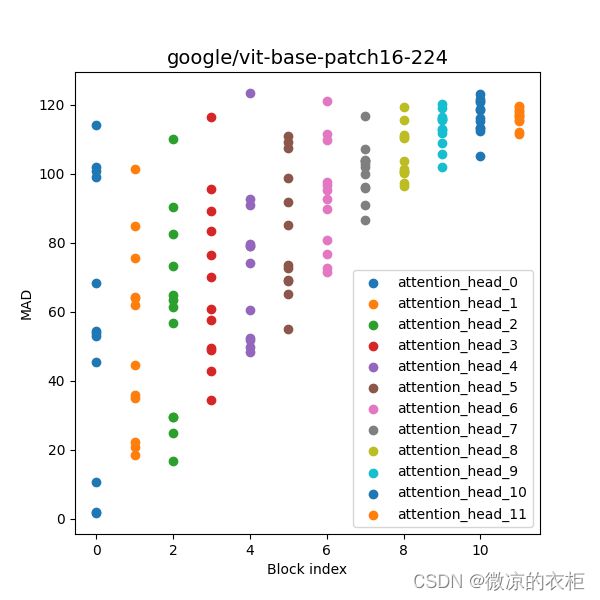
之前在阅读ViT论文的时候对MAD这部分没有十分理解,及MAD究竟是什么,如下图所示.将该部分代码进行调试理解,能够比较深入理解ViT的注意力机制.

Fig 1 vit-base-patch16-224 MAD可视化
2.关键代码讲解
2.1 注意力分数获得
def perform_inference(image: Image, model: torch.nn.Module, processor):
    """Performs inference given an image, a model, and its processor."""
    inputs = processor(image, return_tensors="pt")#[1, 3, 224, 224]
    with torch.no_grad():
        outputs = model(**inputs, output_attentions=True)
        print(type(outputs))

    # model predicts one of the 1000 ImageNet classes
    predicted_label = outputs.logits.argmax(-1).item()
    print(model.config.id2label[predicted_label])
    return outputs.attentions #[[1, 12, 197, 197]*12]
这部分代码将图像输入ViT网络,并得到输出的logits,类别以及ViT中每个block(如图Fig2)中每个head的注意力分数(outputs.attentions).ViT可以看作是transformer的一个encoder,如下:

Fig 2 ViT的一个block
此外,outputs.attentions是一个tuple,其中包括12个维度为[1, 12, 197, 197]的tensor.这个tensor可理解如下,其中12为head的数量,197是token的数量.197*197表示每个token之间的注意力分数.197包含196个图像token与一个cls token.其中MAD是图像token之间的距离
2.2 计算MAD
def gather_mads(attention_scores, patch_size: int = 16):
    all_mean_distances = {
        f"block_{i}_mean_dist": compute_mean_attention_dist(
            patch_size=patch_size, attention_weights=attention_weight.numpy()
        )
        for i, attention_weight in enumerate(attention_scores)
    }
    return all_mean_distances
这段代码是遍历计算每一个block中的MAD
def compute_mean_attention_dist(patch_size, attention_weights):
    # The attention_weights shape = (batch, num_heads, num_patches, num_patches)
    attention_weights = attention_weights[
        ..., num_cls_tokens:, num_cls_tokens:
    ]  # Removing the CLS token, [1, 12, 196, 196]
    num_patches = attention_weights.shape[-1]
    length = int(np.sqrt(num_patches))
    assert length**2 == num_patches, "Num patches is not perfect square"

    distance_matrix = compute_distance_matrix(patch_size, num_patches, length)#[196, 196]
    h, w = distance_matrix.shape

    distance_matrix = distance_matrix.reshape((1, 1, h, w))#[1, 1, 196, 196], space distance between batch in the image
    # The attention_weights along the last axis adds to 1
    # this is due to the fact that they are softmax of the raw logits
    # summation of the (attention_weights * distance_matrix)
    # should result in an average distance per token
    mean_distances = attention_weights * distance_matrix#[1, 12, 196, 196]
    mean_distances = np.sum(
        mean_distances, axis=-1
    )  # sum along last axis to get average distance per token, [1, 12, 196]
    mean_distances = np.mean(
        mean_distances, axis=-1
    )  # now average across all the tokens

    return mean_distances
这段代码则是具体计算MAD.首先计算patch(Fig 1中阐述了什么是patch)之间的距离,ViT中的token可以理解为对每个patch的编码,patch之间的距离计算方法如下:
def compute_distance_matrix(patch_size, num_patches, length):
    """Helper function to compute distance matrix."""
    distance_matrix = np.zeros((num_patches, num_patches))
    for i in range(num_patches):
        for j in range(num_patches):
            if i == j:  # zero distance
                continue

            xi, yi = (int(i / length)), (i % length)
            xj, yj = (int(j / length)), (j % length)
            distance_matrix[i, j] = patch_size * np.linalg.norm([xi - xj, yi - yj])

    return distance_matrix
patch之间的距离即patch之间的空间距离.而MAD的核心计算代码为:
mean_distances = attention_weights * distance_matrix
之后在求每个head中所有token的距离均值.MAD是衡量每个patch与其他patch之间的综合距离,这个距离既考虑了它与其他patch的实际物理距离,又将注意力分数作为物理距离的加权.我对MAD的理解是,它是经过学习,对离散图像patch的一种建模.这种建模既考虑了patch与patch之间的空间关系,又考虑了patch之间实际的联系(注意力分数).这个距离可以用来探究每个head关注的范围,类似CNN中的感受野.
3.总述
接下来再回到Fig 2,我们再来理解这张图的含义.这张图横轴为block的编号,包含12个block,纵轴为每个head的MAD. 可以看到,ViT在浅层中就有的head开始关注全局(MAD大的head),有的关注局部(MAD小的head),这与CNN有所不同,CNN在浅层多关注局部,深层关注全局.因此说明.随着层数的加深,ViT逐步过渡到关注全局.相比于CNN来说,ViT是对图像的更一般的一种建模,这有利于表达更复杂的空间关系,但也更加难学习,因此一般认为在数据量比较大的情况下,ViT才能展现出其优势.