vue编写坐标系以及echarts编写坐标系、highcharts编写坐标系(包含圆形间隔)
文章目录
- 前言
- 一、vue编写坐标系
-
- 2.读入数据
- 三、highcharts编写坐标系(包含圆形间隔)
前言
记录一下,耗时两天
一、vue编写坐标系

代码如下:
// 坐标轴的样式
.heng {
  position: absolute;
  top: 50%;
  left: 50%;
  width: 100%;
  height: 1px;
  transform: translate(-50%, 0);
  background-color: #000;
}

.shu {
  position: absolute;
  left: 50%;
  top: 0;
  width: 1px;
  height: 100%;
  background-color: #000;
}
.arrow {
  position: absolute;
  left: 50%;
  top: 50%;
  width: 150px;
  height: 1px;
  background-color: #000;
  /* transform: rotate(30deg) */
  transform-origin: 0 0;
}

.arrow-red {
  position: absolute;
  top: 0;
  left: 0;
  width: 15px;
  height: 15px;
  border-radius: 50%;
  transform: translate(-50%, -50%);
  background-color: red
}

.arrow-blue {
  position: absolute;
  top: 0;
  right: 0;
  width: 15px;
  height: 15px;
  border-radius: 50%;
  transform: translate(0, -50%);
  background-color: #2A8CEA
}

// 坐标轴
// x1+250是因为轴线是(250,250)。这里有个需要注意,rotate的转动是以线的一端进行转动,所以需要绝对定位去确定位置
<div class="heng"></div>
        <div class="shu"></div>
<div class="arrow" :style="{'transform': 'rotate('+angle+'deg)','width':arrowWidth+'px','left':x1+250+'px','top':-y1+250+'px'}">
          <div class="arrow-red" ></div>
          <div class="arrow-blue"></div>
        </div>


angle() {
      // let xx = Math.atan2((y1 - y2), (x1 - x2))
      // return xx * 180 / Math.PI
      let x = x2 - x1
      let y = y2 - y1
      let z = Math.sqrt(Math.pow(x, 2) + Math.pow(y, 2))
      let cos = y / z
      let radina = Math.acos(cos)
      let angle = 180 / (Math.PI / radina)     // 这个角度是360度的
      // let x2 = this.info.D0145
      // let x1 = this.info.D0147
      // let y2 = this.info.D0146
      // let y1 = this.info.D0148
      // if (x2 > x1 && y2 === y1) {
      //   // 在x轴正方向上
      //   angle = 0;
      // }
      // if (x2 > x1 && y2 < y1) {
      //   console.log(angle)
      //   // 在第一象限;
      //   angle = angle - 90;
      // }
      // if (x2 === x1 && y1 > y2) {
      //   // 在y轴正方向上
      //   angle = -90;
      // }
      // if (x2 < x1 && y2 < y1) {
      //   // 在第二象限
      //   angle = 270 - angle;
      // }
      // if (x2 < x1 && y2 === y1) {
      //   // 在x轴负方向
      //   angle = 180;
      // }
      // if (x2 < x1 && y2 > y1) {
      //   // 在第三象限
      //   angle = 270 - angle;
      // }
      // if (x2 === x1 && y2 > y1) {
      //   // 在y轴负方向上
      //   angle = 90;
      // }
      // if (x2 > x1 && y2 > y1) {
      //   // 在四象限
      //   angle = angle - 90;
      // }
      return angle;
    },
    arrowWidth() {
    // 这是两点之间的长度
      let xx = Math.pow((x1 - x2), 2) + Math.pow((y1 - y2), 2)
      return Math.sqrt(xx)
    }
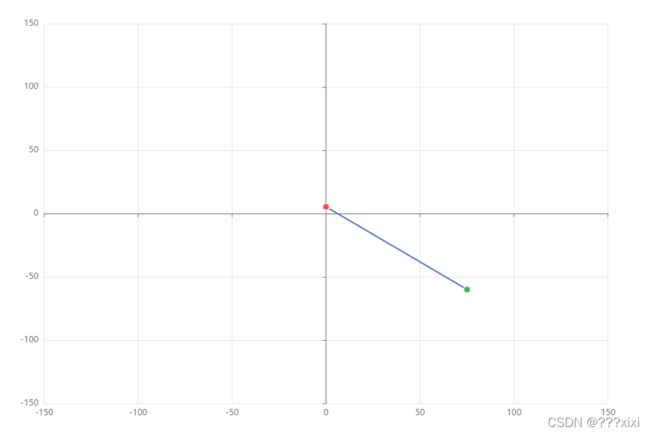
2.读入数据
代码如下(示例):
option = {
  xAxis: {
    type: 'value',
     min:-150,
    max:150
  },
  yAxis: {
    type: 'value',
    min:-150,
    max:150
  },
  series: [
    {

      data: [],
      type: 'line'
    }
  ]
};

let sData = [[0,5.3],[75,-60]]
for(var k=0;k<sData.length;k++){//主要实现改变特定点样式代码
                let obj ={};
                if(k==1){
                        obj = {
                            value:sData[k],
                            symbolSize:10,//拐点大小
                            symbol: 'circle',//拐点样式
                            itemStyle : {
                                  normal: {
                                    color: "#35B65A", //拐点颜色
                                    borderColor:'#eee',
                                    borderWidth:2
                                  },
                            }
                        },
                        option.series[0].data.push(obj)
                }else if(k==0){
                       obj = {
                            value:sData[k],
                            symbolSize:10,//拐点大小
                            symbol: 'circle',
                            itemStyle : {
                                normal: {
                                color: "#FF494A ", //拐点颜色
                                borderColor:'#eee',
                                borderWidth:2
                                },
                            }
                        },
                        option.series[0].data.push(obj)
                }
            }
            setTimeout(() => {
                myChart.setOption(option); //设置option
                myChart.resize(); //防止越界,重绘canvas
            }, 300);
三、highcharts编写坐标系(包含圆形间隔)

<div style="width:100%;height:100%" ref="coordinate" id="coordinate"></div>
let option = {
        title: {
          text: '',
        },
        credits: {
          enabled: false
        },
        legend: {
          enabled: false
        },
        // 这里offset是移动坐标轴的
        xAxis: {
          gridLineWidth: 1,
          min: -150,
          max: 150,
          tickInterval: 10,
          lineColor: 'black',
          offset: -270
        },
        yAxis: {
          min: -150,
          max: 150,
          tickInterval: 10,
          lineWidth: 1,
          lineColor: 'black',
          offset: -455,
          title: {
            text: null
          }
        },
        tooltip: {
          headerFormat: 'x: {point.x}
',
          pointFormat: 'y: {point.y} ',
          shared: true
        },
        // 这是正方形的间隔(红黄蓝)
        series:[
          {data:[
          // 这里是设置线的两端不同颜色
            { x: x1, y: y1,marker:{fillColor:'red'}},
            { x: x2, y: y2, marker: { fillColor: '#2A8CEA' } }
          ],
        color:'#000',
        type: 'line',
      },
          {
            data: [
              [-50, -50], [-50, 50], [50, 50], [50, -50], [-50, -50]
            ],
            color: '#2A8CEA',
            type: 'line',
          },
          {
            data: [
              [-70, -70], [-70, 70], [70, 70], [70, -70], [-70, -70]
            ],
            color: 'goldenrod',
            type: 'line',
          },
          {
            data: [
              [-100, -100], [-100, 100], [100, 100], [100, -100], [-100, -100]
            ],
            color: 'red',
            type: 'line',
          },
        ]

// 这是圆圈的间隔(红黄蓝)
series:[
          {data:[
            { x: x1, y: y1,marker:{fillColor:'red'}},
            { x: x2, y: y2, marker: { fillColor: '#2A8CEA' } }
          ],
        color:'#000',
        name:'x',
            type: 'line',
      },
          {
            type:'pie',
            data: [
            // 这里的x不会在上面的point.x中显示。这里对于画圆没有太大的用处,只有颜色有用
              {
                x:50,
                y:50,
                name:'y',
                color:'#2A8CEA'
              }
            ],
            center: ['50%', '50%'],
            innerSize: '97%',   // 圆的宽度
            size: '33%',        // 圆在哪个位置,固定之后,如果最大最小值改变或者画布改变都需要改变
            dataLabels:{
              enabled:false
            }
          },
          {
            type: 'pie',
            data: [
              {
                x: 70,
                y: 70,
                name: 'y',
                color: 'goldenrod'
              }
            ],
            center: ['50%', '50%'],
            innerSize: '97.5%',
            size: '47.5%',
            dataLabels: {
              enabled: false
            }
          },
          {
            type: 'pie',
            data: [
              {
                x: 100,
                y: 100,
                name: 'y',
                color: 'red'
              }
            ],
            center: ['50%', '50%'],
            innerSize: '98.5%',
            size: '69%',
            dataLabels: {
              enabled: false
            }
          }
        ]
      }
      let xx = self.$refs['coordinate'] ? HighCharts.chart('coordinate', option) : null;