效果
代码
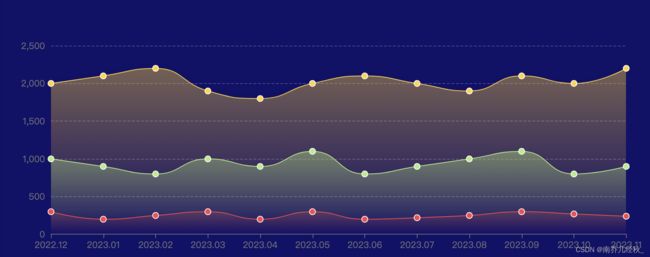
let xData = [
'2022.12',
'2023.01',
'2023.02',
'2023.03',
'2023.04',
'2023.05',
'2023.06',
'2023.07',
'2023.08',
'2023.09',
'2023.10',
'2023.11'
];
let { nopass, pass, good } = {
good: [1000, 900, 800, 1000, 900, 1100, 800, 900, 1000, 1100, 800, 900],
nopass: [300, 200, 250, 300, 200, 300, 200, 220, 250, 300, 270, 240],
pass: [2000, 2100, 2200, 1900, 1800, 2000, 2100, 2000, 1900, 2100, 2000, 2200]
};
option = {
backgroundColor: '#140a69',
tooltip: {
trigger: 'axis',
backgroundColor: 'rgba(69, 14, 255,0.5)',
borderWidth: '0',
textStyle: {
color: '#6DFFFF'
},
axisPointer: {
type: 'shadow'
}
},
grid: {
left: '3%',
right: '4%',
bottom: '3%',
containLabel: true
},
xAxis: [
{
type: 'category',
boundaryGap: false,
axisLabel: {
show: true
},
axisLine: {
show: true
},
splitLine: {
show: false
},
data: xData
}
],
yAxis: [
{
type: 'value',
splitLine: {
show: true,
lineStyle: {
color: 'rgba(255, 255, 255, 0.25)',
type: 'dashed'
}
}
}
],
series: [
{
name: 'good',
smooth: true,
type: 'line',
symbol: 'circle',
symbolSize: 8,
itemStyle: {
normal: {
color: '#B1ED82',
borderColor: '#fff',
borderWidth: 1,
lineStyle: {
color: '#B1ED82 ',
width: 1
}
}
},
areaStyle: {
normal: {
color: new echarts.graphic.LinearGradient(
0,
0,
0,
1,
[
{
offset: 0,
color: 'rgba(177, 237, 130, 0.6)'
},
{
offset: 1,
color: 'rgba(177, 237, 130, 0)'
}
],
false
),
shadowColor: 'rgba(0, 0, 0, 0.1)',
shadowBlur: 10
}
},
data: good
},
{
smooth: true,
type: 'line',
name: 'pass',
symbol: 'circle',
symbolSize: 8,
itemStyle: {
normal: {
color: '#FFD639',
borderColor: '#fff',
borderWidth: 1,
lineStyle: {
color: '#FFD639',
width: 1
}
}
},
areaStyle: {
normal: {
color: new echarts.graphic.LinearGradient(
0,
0,
0,
1,
[
{
offset: 0,
color: 'rgba(255, 214, 57, 0.6)'
},
{
offset: 1,
color: 'rgba(255, 214, 57, 0)'
}
],
false
),
shadowColor: 'rgba(0, 0, 0, 0.1)',
shadowBlur: 10
}
},
data: pass
},
{
smooth: true,
type: 'line',
name: 'nopass',
symbol: 'circle',
symbolSize: 8,
itemStyle: {
normal: {
color: '#FC424C',
borderColor: '#fff',
borderWidth: 1,
lineStyle: {
color: '#FC424C',
width: 1
}
}
},
areaStyle: {
normal: {
color: new echarts.graphic.LinearGradient(
0,
0,
0,
1,
[
{
offset: 0,
color: 'rgba(252, 66, 76, 0.3)'
},
{
offset: 1,
color: 'rgba(252, 66, 76, 0)'
}
],
false
),
shadowColor: 'rgba(0, 0, 0, 0.1)',
shadowBlur: 10
}
},
data: nopass
}
]
};