k8s收集日志
k8s收集日志
写在前面: k8s在1.23版本之后就不用fluentd-es来收集日志了,而是把日志通过fluentd把日志直接打到存储,所以下面的文件在后面的版本已经没有了,不过还是照样可以用
一.收集控制台日志
采用fluentd+es+kibana来做
所需要的文件可以在这里找
https://github.com/kubernetes/kubernetes/tree/v1.23.0/cluster/addons/fluentd-elasticsearch
1.创建目录并下载所需文件
cd /root/k8s/yaml/efk
[root@worker1 efk]# ll
total 44
-rw-r--r-- 1 root root   172 Dec 28 15:58 create-logging-namespace.yaml
-rw-r--r-- 1 root root   572 Dec 28 15:59 es-service.yaml
-rw-r--r-- 1 root root  3153 Dec 28 16:05 es-statefulset.yaml
drwxr-xr-x 2 root root  4096 Dec 28 23:15 filebeat
-rw-r--r-- 1 root root 16121 Dec 28 15:58 fluentd-es-configmap.yaml
-rw-r--r-- 1 root root  2569 Dec 28 15:58 fluentd-es-ds.yaml
-rw-r--r-- 1 root root  1542 Dec 28 16:09 kibana-deployment.yaml
-rw-r--r-- 1 root root   387 Dec 28 16:29 kibana-service.yaml
2.创建es
基本不需要改动,yaml文件下载下来直接创建就行
kubectl create -f create-logging-namespace.yaml
kubectl create -f es-service.yaml
kubectl create -f es-statefulset.yaml
查看
kubectl get pod.svc -n logging
NAME                                       READY   STATUS    RESTARTS   AGE
pod/elasticsearch-logging-0                1/1     Running   0          17h


NAME                            TYPE        CLUSTER-IP        EXTERNAL-IP   PORT(S)                      AGE
service/elasticsearch-logging   ClusterIP   192.168.253.134   <none>        9200/TCP,9300/TCP            17h
测试
[root@worker1 efk]# curl 192.168.253.134:9200
{
  "name" : "elasticsearch-logging-0",
  "cluster_name" : "kubernetes-logging",
  "cluster_uuid" : "TgivkC3MTiCSUYoKdJJ7Nw",
  "version" : {
    "number" : "7.10.2",
    "build_flavor" : "oss",
    "build_type" : "docker",
    "build_hash" : "747e1cc71def077253878a59143c1f785afa92b9",
    "build_date" : "2021-01-13T00:42:12.435326Z",
    "build_snapshot" : false,
    "lucene_version" : "8.7.0",
    "minimum_wire_compatibility_version" : "6.8.0",
    "minimum_index_compatibility_version" : "6.0.0-beta1"
  },
  "tagline" : "You Know, for Search"
}
3.创建fluentd
kubectl create -f fluentd-es-configmap.yaml
kubectl create -f fluentd-es-ds.yaml
这里我贴一下自己的文件,里面有些东西改了
fluentd-es-configmap.yaml
kind: ConfigMap
apiVersion: v1
metadata:
name: fluentd-es-config-v0.2.1
namespace: logging
labels:
addonmanager.kubernetes.io/mode: Reconcile
data:
system.conf: |-
root_dir /tmp/fluentd-buffers/
containers.input.conf: |-
@id fluentd-containers.log
@type tail
path /var/log/containers/*.log
pos_file /var/log/es-containers.log.pos
tag raw.kubernetes.*
read_from_head true
@type multi_format
format json
time_key time
time_format %Y-%m-%dT%H:%M:%S.%NZ
format /^(?
# Detect exceptions in the log output and forward them as one log entry.
@id raw.kubernetes
@type detect_exceptions
remove_tag_prefix raw
message log
stream stream
multiline_flush_interval 5
max_bytes 500000
max_lines 1000
# Concatenate multi-line logs
@id filter_concat
@type concat
key message
multiline_end_regexp /\n$/
separator ""
# Enriches records with Kubernetes metadata
@id filter_kubernetes_metadata
@type kubernetes_metadata
# Fixes json fields in Elasticsearch
@id filter_parser
@type parser
key_name log
reserve_data true
remove_key_name_field true
@type multi_format
format json
format none
system.input.conf: |-
# Example:
# 2015-12-21 23:17:22,066 [salt.state ][INFO ] Completed state [net.ipv4.ip_forward] at time 23:17:22.066081
@id minion
@type tail
format /^(?
# Example:
# Dec 21 23:17:22 gke-foo-1-1-4b5cbd14-node-4eoj startupscript: Finished running startup script /var/run/google.startup.script
@id startupscript.log
@type tail
format syslog
path /var/log/startupscript.log
pos_file /var/log/es-startupscript.log.pos
tag startupscript
# Examples:
# time="2016-02-04T06:51:03.053580605Z" level=info msg="GET /containers/json"
# time="2016-02-04T07:53:57.505612354Z" level=error msg="HTTP Error" err="No such image: -f" statusCode=404
# TODO(random-liu): Remove this after cri container runtime rolls out.
@id docker.log
@type tail
format /^time="(?
# Example:
# 2016/02/04 06:52:38 filePurge: successfully removed file /var/etcd/data/member/wal/00000000000006d0-00000000010a23d1.wal
@id etcd.log
@type tail
# Not parsing this, because it doesn't have anything particularly useful to
# parse out of it (like severities).
format none
path /var/log/etcd.log
pos_file /var/log/es-etcd.log.pos
tag etcd
# Multi-line parsing is required for all the kube logs because very large log
# statements, such as those that include entire object bodies, get split into
# multiple lines by glog.
# Example:
# I0204 07:32:30.020537 3368 server.go:1048] POST /stats/container/: (13.972191ms) 200 [[Go-http-client/1.1] 10.244.1.3:40537]
@id kubelet.log
@type tail
format multiline
multiline_flush_interval 5s
format_firstline /^\w\d{4}/
format1 /^(?\w)(? fluentd-es-ds.yaml
apiVersion: v1
kind: ServiceAccount
metadata:
  name: fluentd-es
  namespace: logging
  labels:
    k8s-app: fluentd-es
    addonmanager.kubernetes.io/mode: Reconcile
---
kind: ClusterRole
apiVersion: rbac.authorization.k8s.io/v1
metadata:
  name: fluentd-es
  labels:
    k8s-app: fluentd-es
    addonmanager.kubernetes.io/mode: Reconcile
rules:
- apiGroups:
  - ""
  resources:
  - "namespaces"
  - "pods"
  verbs:
  - "get"
  - "watch"
  - "list"
---
kind: ClusterRoleBinding
apiVersion: rbac.authorization.k8s.io/v1
metadata:
  name: fluentd-es
  labels:
    k8s-app: fluentd-es
    addonmanager.kubernetes.io/mode: Reconcile
subjects:
- kind: ServiceAccount
  name: fluentd-es
  namespace: logging
  apiGroup: ""
roleRef:
  kind: ClusterRole
  name: fluentd-es
  apiGroup: ""
---
apiVersion: apps/v1
kind: DaemonSet
metadata:
  name: fluentd-es-v3.1.1
  namespace: logging
  labels:
    k8s-app: fluentd-es
    version: v3.1.1
    addonmanager.kubernetes.io/mode: Reconcile
spec:
  selector:
    matchLabels:
      k8s-app: fluentd-es
      version: v3.1.1
  template:
    metadata:
      labels:
        k8s-app: fluentd-es
        version: v3.1.1
    spec:
      securityContext:
        seccompProfile:
          type: RuntimeDefault
      priorityClassName: system-node-critical
      serviceAccountName: fluentd-es
      containers:
      - name: fluentd-es
        image: registry.cn-beijing.aliyuncs.com/dotbalo/fluentd:v3.1.0
        env:
        - name: FLUENTD_ARGS
          value: --no-supervisor -q
        resources:
          limits:
            memory: 500Mi
          requests:
            cpu: 100m
            memory: 200Mi
        volumeMounts:
        - name: varlog
          mountPath: /var/log
        - name: varlogcontainers
          mountPath: /var/log/containers
          readOnly: true
        - name: dockercontainerlogdirectory
          mountPath: /var/log/pods
          readOnly: true
        - name: config-volume
          mountPath: /etc/fluent/config.d
        ports:
        - containerPort: 24231
          name: prometheus
          protocol: TCP
        livenessProbe:
          tcpSocket:
            port: prometheus
          initialDelaySeconds: 5
          timeoutSeconds: 10
        readinessProbe:
          tcpSocket:
            port: prometheus
          initialDelaySeconds: 5
          timeoutSeconds: 10
      terminationGracePeriodSeconds: 30
      nodeSelector:
        fluentd: "true"
      volumes:
      - name: varlog
        hostPath:
          path: /var/log
      - name: varlogcontainers
        hostPath:
          path: /var/log/containers
      - name: dockercontainerlogdirectory
        hostPath:
          path: /var/log/pods
      - name: config-volume
        configMap:
          name: fluentd-es-config-v0.2.1
4.创建kibana
kibana的两个文件需要稍作修改
kibana-service.yaml
apiVersion: v1
kind: Service
metadata:
  name: kibana-logging
  namespace: logging
  labels:
    k8s-app: kibana-logging
    kubernetes.io/cluster-service: "true"
    addonmanager.kubernetes.io/mode: Reconcile
    kubernetes.io/name: "Kibana"
spec:
  type: NodePort
  ports:
  - port: 5601
    protocol: TCP
    targetPort: ui
    nodePort: 30022
  selector:
    k8s-app: kibana-logging
kibana-deployment.yaml
将文件中的下面两行注释掉,不然访问不了
#            - name: SERVER_BASEPATH
#              value: /api/v1/namespaces/logging/services/kibana-logging/proxy
然后创建
kubectl create -f kibana-service.yaml
kubectl create -f kibana-deployment.yaml
5.浏览器访问kibana
先创建对应的索引,然后选择需要的字段,就可以看到内容了
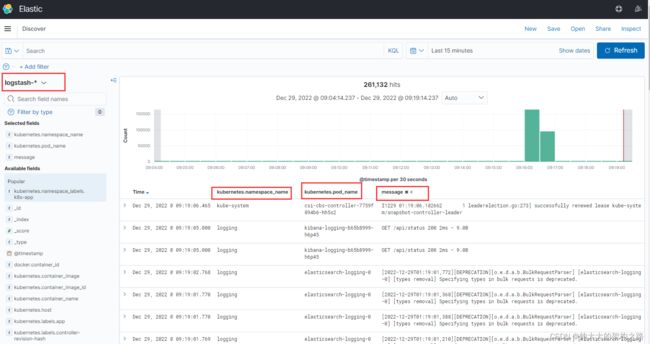
注意: 这种方式主要是收集k8s打到控制台的日志,也就是/var/lib/docker/containers这里的json日志文件,收集这种日志文件还有个前提,就是你的k8s运行时组件是docker,而不是container,要不然是收集不到的,接下来是收集业务容器内日志
containerd :
日志存储路径:
真实路径:/var/log/pods/$CONTAINER_NAMES
软连接:同时kubelet也会在/var/log/containers目录下创建软链接指向/var/log/pods/$CONTAINER_NAMES
docker:
真实路径:/var/lib/docker/containers/$CONTAINERID
软连接:kubelet会在/var/log/pods和/var/log/containers创建软连接指向/var/lib/docker/containers/$CONTAINERID
============================== 分割线 =============================================
二.收集业务容器内日志
这种架构是采用filebeat+kafka+zookeeper+logstash+es+kibana来做的,所需的文件可以在这找
https://github.com/dotbalo/k8s/tree/master/fklek/7.x
1.安装zookeeper+kafka
我们采用helm的方式来安装,比较快
wget https://get.helm.sh/helm-v3.1.2-linux-amd64.tar.gz
tar xf helm-v3.1.2-linux-amd64.tar.gz
mv linux-amd64/ helm
cd helm/
cp -r helm /usr/local/bin/
helm version

添加两个仓库
helm repo add bitnami https://charts.bitnami.com/bitnami
helm repo add ali-stable https://kubernetes.oss-cn-hangzhou.aliyuncs.com/charts
注意最后的 点 别忘了
helm pull bitnami/zookeeper
tar xf zookeeper-11.1.2.tgz
cd zookeeper/
helm install zookeeper -n logging --set auth.enabled=false --set allowAnonymousLogin=true --set persistence.enabled=false .
cd ../
helm pull bitnami/kafka
tar xf kafka-20.0.6.tgz
cd kafka/
helm install kafka -n logging --set zookeeper.enabled=false --set replicaCount=1 --set externalZookeeper.servers=zookeeper --set persistence.enabled=false .

kubectl get pod -n logging
注意:如果需要调整一些参数,需要编辑values.yaml文件
另外,helm卸载命令如下
helm uninstall zookeeper -n logging
2.安装logstash
logstash的版本最好和之前安装的es的版本一致
cd /root/k8s/yaml/efk/filebeat/
kubectl create -f filebeat-cm.yaml -n logging
kubectl create -f logstash-cm.yaml -n logging
kubectl create -f logstash-service.yaml -n logging
kubectl create -f logstash-deploy.yaml -n logging
3.安装业务pod
业务pod以便车模式绑定filebeat容器,然后共享日志目录,这样filebeat就可以直接收集对应日志,并发送到kafka,再由logstash打到es
kubectl create -f app.yaml -n logging
安装的时候,下面记得修改为你自己的标签
nodeSelector:
         kubernetes.io/hostname: 172.16.0.2
4.浏览器访问kibana
建立索引,然后查看数据,查看之前先生成一些数据,进到app业务pod中,再到共享的日志目录,创建日志文件,循环写入一些日志
kubectl exec -it -n logging app-8477d9675b-fd4v5 -c app -- sh
cd /home/tomcat/target/
touch 123.log
for i in `seq 1 100`;do echo $i >> 123.log ;done
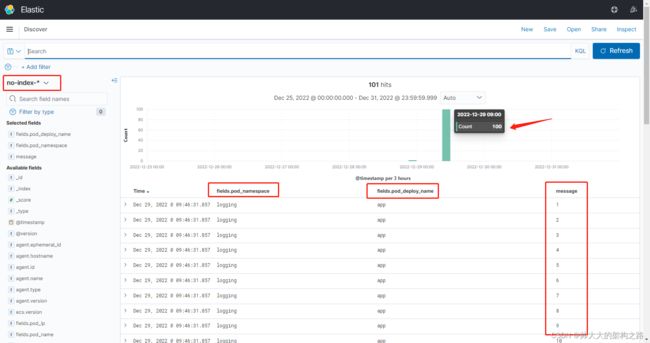
这个索引名字是在logstash-cm.yaml 中定义的,可自行查看
图中可以看到收集到的日志信息