【python绘图】爱心、樱花树、饼图、折线图、雷达图
一、爱心
import turtle

def curvemove():
  for i in range(200):
    turtle.speed(0)
    turtle.right(1) # 光标向右偏1度
    turtle.forward(1)#  前进1px

turtle.penup()
turtle.goto(0, -70)
turtle.pendown()

turtle.color('red')
turtle.begin_fill()
turtle.left(140)
turtle.forward(111.65)
curvemove()
turtle.left(120)
curvemove()
turtle.forward(111.65)
turtle.end_fill()
turtle.done()

turtle.penup()
turtle.goto(-40, -50)
turtle.pendown()
turtle.write('看看看看',  font = ('SimHei', 15, 'bold'))
#turtle.hideturtle()
二、樱花树
(每一次运行的樱花长得不一样)
import turtle as T
import random
import time

# 画樱花的躯干
def Tree(branch, t):
  time.sleep(0.0005)
  if branch > 3:
    if 8 <= branch <= 12:
      if random.randint(0, 2) == 0:
        # 白色
        t.color('snow')
      else:
        # 淡珊瑚色
        t.color('lightcoral')
      t.pensize(branch / 3)
    elif branch < 8:
      if random.randint(0, 1) == 0:
        t.color('snow')
      else:
        t.color('lightcoral')
      t.pensize(branch / 2)
    else:
      # 赭色
      t.color('sienna')
      t.pensize(branch / 10)
    t.forward(branch)
    a = 1.5 * random.random()
    t.right(20 * a)
    b = 1.5 * random.random()
    Tree(branch - 10 * b, t)
    t.left(40 * a)
    Tree(branch - 10 * b, t)
    t.right(20 * a)
    t.up()
    t.backward(branch)
    t.down()

# 掉落的花瓣
def Petal(m, t):
  for i in range(m):
    a = 200 - 400 * random.random()
    b = 10 - 20 * random.random()
    t.up()
    t.forward(b)
    t.left(90)
    t.forward(a)
    t.down()
    t.color('lightcoral')
    t.circle(1)
    t.up()
    t.backward(a)
    t.right(90)
    t.backward(b)
    # 绘图区域
t = T.Turtle()
# 画布大小
w = T.Screen()
# 隐藏画笔
t.hideturtle()
t.getscreen().tracer(5, 0)
t.left(90)
t.up()
t.backward(150)
t.down()
t.color('sienna')

# 画樱花的躯干
Tree(60, t)
# 掉落的花瓣
Petal(200, t)

turtle.done()
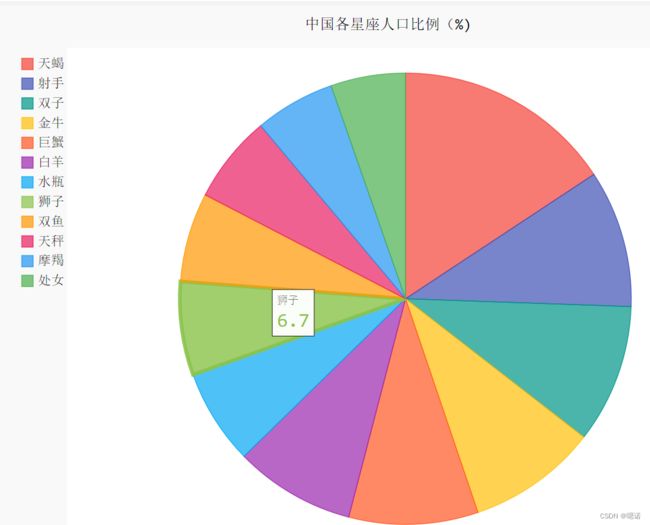
三、饼图
(点击运行,顺利结束后,左侧的目录栏会多了对应的文件结果,点击在浏览器查看)
import pygal

pie_chart = pygal.Pie()
pie_chart.title = '中国各星座人口比例(%)'
pie_chart.add('天蝎', 15.74)
pie_chart.add('射手', 9.86)
pie_chart.add('双子', 9.97)
pie_chart.add('金牛', 9.31)
pie_chart.add('巨蟹', 9.27)
pie_chart.add('白羊', 8.66)
pie_chart.add('水瓶', 6.85)
pie_chart.add('狮子', 6.70)
pie_chart.add('双鱼', 6.40)
pie_chart.add('天秤', 6.31)
pie_chart.add('摩羯', 5.75)
pie_chart.add('处女', 5.36)

# 将生成的文件保存成svg
pie_chart.render_to_file('Pie_chart.svg')
四、折线图
import pygal
line_chart = pygal.Line()
line_chart.title = '各科成绩趋势图'
line_chart.x_labels = map(str, range(1, 6))
line_chart.add('数学', [66, 58, 70, 72, 76, 78])
line_chart.add('语文', [88, 89, 90, 88, 86, 82])
line_chart.add('英语', [98, 99, 99, 96, 100, 98])
line_chart.render_to_file('Pie_chart.svg')
五、雷达图
import pygal
radar_chart = pygal.Radar()
radar_chart.title = '餐厅评分数据'
radar_chart.x_labels = ['味道', '卫生', '服务', '价格', '环境']
radar_chart.add('老王炸鸡', [9, 6, 6, 4, 7])
radar_chart.add('小明快餐', [7, 8, 9, 6, 8])
radar_chart.add('阿强烧烤', [10, 4, 6, 8, 4])
radar_chart.add('萌仔汉堡', [7, 6, 5, 4, 6])
radar_chart.render_to_file('Pie_chart.svg')


