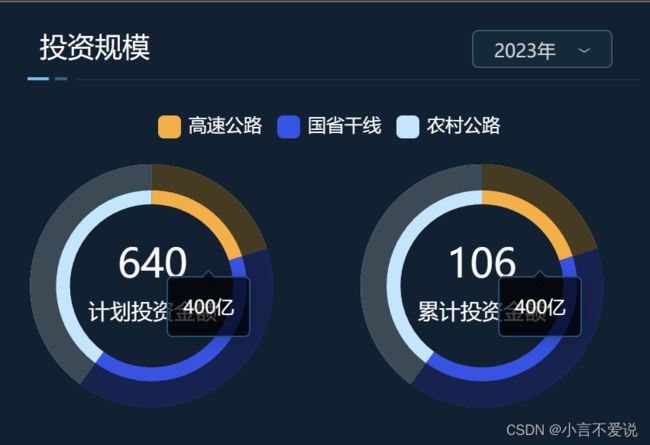
Echarts环形图阴影,多图联动,图示数据循环展示
Echarts环形图阴影,多图联动,图示数据循环展示
- 成果展示
- 环形图阴影
- 多图联动
- 图示数据循环展示
成果展示
环形图阴影
实现环形图阴影,首先说明,这样的环形图是依靠两个圆的拼接而形成的,其中,两个圆的数据相同,使用同一个图例。
修改圆圈的大小,在series.radius之中,一个外环一个内环。中间字体位置则是title属性配置中进行的。以下的实例只展示了其中一个图的实现,两图本质一样的。
 var chartDom = document.getElementById('main');
  var myChart = echarts.init(chartDom);
  var option;
  var data =[200 , 400 ,400];

  option = {
    tooltip: {
      trigger: 'item',
      backgroundColor: 'rgba(0,0,0,0.73)',
      borderColor:'#00527B',
      borderRadius: 4,
      textStyle:{
        fontSize: 12,
        fontFamily: 'Microsoft YaHei',
        fontWeight: 400,
        color: '#FFFFFF',
        height:12,
        textBorderType :'solid'
      },
      formatter:'{c}亿'
    },
    legend: {
      top: '18px',
      left: 'center',
      itemHeight: 15,
      itemWidth: 15,
      textStyle: {
        color: '#FFFFFF'
      },
    },
    title: [
      { // 第一个圆环标题
        text: '640', // 主标题
        textStyle: { // 主标题样式
          color: '#FFFFFF',
          fontWeight: 400,
          fontSize: '26px'
        },
        left: '22%', // 定位到适合的位置
        top: '45%', // 定位到适合的位置
        subtext: '计划投资金额', // 副标题
        subtextStyle: { // 副标题样式
          color: '#FFFFFF',
          fontSize: '14px',
          fontWeight: 400
        },
        textAlign: 'center', // 主、副标题水平居中显示
      },
    ],
    series: [
      {
        name: '',
        top: '5px',
        center: ['23%', '57%'],
        type: 'pie',
        radius: ['47%', '70%'],//修改圆圈大小
        avoidLabelOverlap: false,
        label: {
          show: false,//开启提示线文字
        },
        emphasis: {
          scale: false,//鼠标划上不展示高亮放大效果
          label: {
            show: false,
          }
        },
        labelLine: {
          show: false
        },
        data: [
          {
            value: 200, name: '高速公路',
            itemStyle: {
              color: '#FFAC26',
            }
          },
          {
            value: 400, name: '国省干线',
            itemStyle: {
              color: '#2F54EB',
            }
          },
          {
            value: 400, name: '农村公路',
            itemStyle: {
              color: '#BAE7FF',
            }
          },
        ]
      },
      {
        name: '',
        top: '5px',
        type: 'pie',
        center: ['23%', '57%'],
        radius: ['55%', '70%'],//修改圆圈大小
        avoidLabelOverlap: false,

        label: {
          show: false,
          position: 'center',
        },
        emphasis: {
          scale: false,//鼠标划上不展示高亮放大效果
          label: {
            show: false,
          }
        },
        labelLine: {
          show: false
        },
        data: [
          {
            value: 200, name: '高速公路',
            itemStyle: {
              color: '#322F1D',
              opacity: 0.9
            },
          },
          {
            value: 400, name: '国省干线',
            itemStyle: {
              color: '#0E1E40',
              opacity: 0.9
            },
          },
          {
            value: 400, name: '农村公路',
            itemStyle: {
              color: '#2A3A45',
              opacity: 0.9
            },
          },
        ]
      },
    ]

  };

  option && myChart.setOption(option);
多图联动
多图联动可以实现两个图的动作完全一致,点击一个图的图例,另一个图如果数据名称(此处为配置项为,注意观察位置series.data.name)一致,则会一起变化,实现一个图例操作两个图的效果。还能实现很多的操作,例如鼠标移动显示图示数据,以及我在后面介绍的循环,它的操作欢迎各位探索
实现图的时候,总有两行代码开头
 var chartDom = document.getElementById('main');
  var myChart = echarts.init(chartDom);
这个myChart 就是图例的名字,将其和想要联动的图名字一起放入下面的语句中,就成功了。
//多图表联动配置方法1:直接传入需要联动的echarts对象myChart1,myChart2
  echarts.connect([myChart,myChart1]);
此处只展示一种方法,另一种方法为:
分别设置每个ECharts对象为相同的group值,并通过在调用ECharts对象的connect方法时,传入group值,从而使用多个ECharts对象建立联动关系,格式如下。
myChart1.group = ‘group1’; //给第1个ECharts对象设置一个group值
myChart2.group = ‘group1’; //给第2个ECharts对象设置一个相同的group值
echarts.connect(‘group1’); //调用ECharts对象的connect方法时,传入group值
以下是方法二的参考链接:
参考链接
图示数据循环展示
放在 option && myChart.setOption(option);后面即可,我也是从链接的地方学习的。
参考链接
 // 实现自动播放tooltip的方法
  var index = 0; //播放所在下标
  var mTime = setInterval(function() {
    myChart.dispatchAction({
      type: 'showTip',
      seriesIndex: 0,
      dataIndex: index
    });
    index++;
    if(index > data.length) {
      index = 0;
    }
  }, 1000);
最后,附上完整的代码:
<script lang="ts" setup>
import * as echarts from 'echarts/core';
import {TooltipComponent, LegendComponent} from 'echarts/components';
import {PieChart} from 'echarts/charts';
import {LabelLayout} from 'echarts/features';
import {CanvasRenderer} from 'echarts/renderers';
import {onMounted} from "vue";


echarts.use([
  TooltipComponent,
  LegendComponent,
  PieChart,
  CanvasRenderer,
  LabelLayout
]);
onMounted(() => {
  createChart();
});

function createChart() {
  var chartDom = document.getElementById('main');
  var myChart = echarts.init(chartDom);
  var option;
  var data =[200 , 400 ,400];

  option = {
    tooltip: {
      trigger: 'item',
      backgroundColor: 'rgba(0,0,0,0.73)',
      borderColor:'#00527B',
      borderRadius: 4,
      textStyle:{
        fontSize: 12,
        fontFamily: 'Microsoft YaHei',
        fontWeight: 400,
        color: '#FFFFFF',
        height:12,
        textBorderType :'solid'
      },
      formatter:'{c}亿'
    },
    legend: {
      top: '18px',
      left: 'center',
      itemHeight: 15,
      itemWidth: 15,
      textStyle: {
        color: '#FFFFFF'
      },
    },
    title: [
      { // 第一个圆环标题
        text: '640', // 主标题
        textStyle: { // 主标题样式
          color: '#FFFFFF',
          fontWeight: 400,
          fontSize: '26px'
        },
        left: '22%', // 定位到适合的位置
        top: '45%', // 定位到适合的位置
        subtext: '计划投资金额', // 副标题
        subtextStyle: { // 副标题样式
          color: '#FFFFFF',
          fontSize: '14px',
          fontWeight: 400
        },
        textAlign: 'center', // 主、副标题水平居中显示
      },
    ],
    series: [
      {
        name: '',
        top: '5px',
        center: ['23%', '57%'],
        type: 'pie',
        radius: ['47%', '70%'],
        avoidLabelOverlap: false,
        label: {
          show: false,//开启提示线文字
        },
        emphasis: {
          scale: false,//鼠标划上不展示高亮放大效果
          label: {
            show: false,
          }
        },
        labelLine: {
          show: false
        },
        data: [
          {
            value: 200, name: '高速公路',
            itemStyle: {
              color: '#FFAC26',
            }
          },
          {
            value: 400, name: '国省干线',
            itemStyle: {
              color: '#2F54EB',
            }
          },
          {
            value: 400, name: '农村公路',
            itemStyle: {
              color: '#BAE7FF',
            }
          },
        ]
      },
      {
        name: '',
        top: '5px',
        type: 'pie',
        center: ['23%', '57%'],
        radius: ['55%', '70%'],
        avoidLabelOverlap: false,

        label: {
          show: false,
          position: 'center',
        },
        emphasis: {
          scale: false,//鼠标划上不展示高亮放大效果
          label: {
            show: false,
          }
        },
        labelLine: {
          show: false
        },
        data: [
          {
            value: 200, name: '高速公路',
            itemStyle: {
              color: '#322F1D',
              opacity: 0.9
            },
          },
          {
            value: 400, name: '国省干线',
            itemStyle: {
              color: '#0E1E40',
              opacity: 0.9
            },
          },
          {
            value: 400, name: '农村公路',
            itemStyle: {
              color: '#2A3A45',
              opacity: 0.9
            },
          },
        ]
      },
    ]

  };

  option && myChart.setOption(option);

  // 实现自动播放tooltip的方法
  var index = 0; //播放所在下标
  var mTime = setInterval(function() {
    myChart.dispatchAction({
      type: 'showTip',
      seriesIndex: 0,
      dataIndex: index
    });
    index++;
    if(index > data.length) {
      index = 0;
    }
  }, 1000);


  //二图

  var chartDom1 = document.getElementById('myMain');
  var myChart1 = echarts.init(chartDom1);
  var option1;
  var data1 =[200 , 400 ,400];

  option1 = {
    tooltip: {
      trigger: 'item',
      backgroundColor: 'rgba(0,0,0,0.73)',
      borderColor:'#00527B',
      borderRadius: 4,
      textStyle:{
        fontSize: 12,
        fontFamily: 'Microsoft YaHei',
        fontWeight: 400,
        color: '#FFFFFF',
        height:12,
        textBorderType :'solid'
      },
      formatter:'{c}亿'
    },
    legend: {
      show:false,
      top: '18px',
      left: 'center',
      itemHeight: 15,
      itemWidth: 15,
      textStyle: {
        color: '#FFFFFF'
      },
    },
    title: [
      {// 第二个圆环标题
        text: '106',
        textStyle: {
          color: '#FFFFFF',
          fontWeight: 400,
          fontSize: '26px'
        },
        left: '72%',
        top: '45%',
        subtext: '累计投资金额',
        subtextStyle: {
          color: '#FFFFFF',
          fontSize: '14px',
          fontWeight: 400,
          font: 'Microsoft YaHei',
        },
        textAlign: 'center'
      }
    ],
    series: [
      {
        name: '',
        top: '5px',
        left: '200px',
        center: ['50%', '57%'],
        type: 'pie',
        radius: ['47%', '70%'],
        avoidLabelOverlap: false,
        label: {
          show: false,//开启提示线文字
        },
        emphasis: {
          scale: false,//鼠标划上不展示高亮放大效果
          label: {
            show: false,
          }
        },
        labelLine: {
          show: false
        },
        data: [
          {
            value: 200, name: '高速公路',
            itemStyle: {
              color: '#FFAC26',
            }
          },
          {
            value: 400, name: '国省干线',
            itemStyle: {
              color: '#2F54EB',
            }
          },
          {
            value: 400, name: '农村公路',
            itemStyle: {
              color: '#BAE7FF',
            }
          },
        ]
      },
      {
        name: '',
        top: '5px',
        left: '200px',
        center: ['50%', '57%'],
        type: 'pie',
        radius: ['55%', '70%'],
        avoidLabelOverlap: false,

        label: {
          show: false,
          position: 'center',
        },
        emphasis: {
          scale: false,//鼠标划上不展示高亮放大效果
          label: {
            show: false,
          }
        },
        labelLine: {
          show: false
        },
        data: [
          {
            value: 200, name: '高速公路',
            itemStyle: {
              color: '#322F1D',
              opacity: 0.9
            },
          },
          {
            value: 400, name: '国省干线',
            itemStyle: {
              color: '#0E1E40',
              opacity: 0.9
            },
          },
          {
            value: 400, name: '农村公路',
            itemStyle: {
              color: '#2A3A45',
              opacity: 0.9
            },
          },
        ]
      },
    ]

  };

  option1 && myChart1.setOption(option1);


//多图表联动配置方法2:直接传入需要联动的echarts对象myChart1,myChart2
  echarts.connect([myChart,myChart1]);
}


</script>
希望文章对各位有所帮助。
