掌握JXLS:高效Java Excel处理库的终极指南
jxls是一个轻量级的Java库,用于基于模板的Excel报表生成。
jxls作为一个开源工具,提供了一种高效且易于维护的方式来处理复杂的Excel导出需求。它允许用户通过在Excel模板中放置特定的标记或注释来定义数据的输出格式和布局,从而避免了编写大量重复且易出错的代码。
以下是jxls的一些主要特点:
- 简单性:jxls的设计哲学是简单和直观,使得即使是初学者也能快速上手并使用它来创建复杂的Excel报表。
- 灵活性:通过在Excel模板中使用类似jsp的标签,jXls提供了极高的灵活性,可以轻松地生成各种格式的报表。
- 轻量级:与其他Java Excel库相比,jxls更加轻量,不会给项目增加太多的负担。
- 功能强大:jxls特别适合于处理包含固定样式、合并单元格和动态列等复杂要求的Excel导出任务。
- 易于维护:使用jxls可以减少因手动编码导致的维护成本和出错概率,提高项目的可维护性。
添加jar
很高兴在编写文章时发现jxls的大版本升级了,所使用的jdk版本也来到了17。
对于原先的jxls2.x版本的使用者来说,
新的构建器 API 取代了 JxlsHelper。 TransformerFactory 和 createTransformer() 方法也已被删除。
Context 现在包含创建报表所需的所有信息。 但数据以Map
<dependency>
    <groupId>org.jxls</groupId>
    <artifactId>jxls-poi</artifactId>
    <version>3.0.0</version>
</dependency>
XlsArea 区域
Area是jXLS中的一个主要概念,它本质上代表了一个矩形区域,这个区域包含了需要进行数据转换的单元格。每个Area可以包含一组转换命令和一组嵌套的子区域,这些子区域也是Area,它们有自己的命令和子区域。
如下命令表示需要处理的区域为从A1至K列第4行:
jx:area(lastCell="K4")
创建报表
因为大版本的升级,我们不再使用如下方式:
Context context = new Context();
context.putVar("list", list);
JxlsHelper.getInstance().setEvaluateFormulas(evaluateFormulas).processTemplate(inputStream, outPutStream, context);
而是:
Map<String, Object> data = new HashMap<>();
data.put("employees", employees);
JxlsPoiTemplateFillerBuilder.newInstance()
        .withTemplate("template.xlsx")
        .build()
        .fill(data, new File("report.xlsx"));
循环
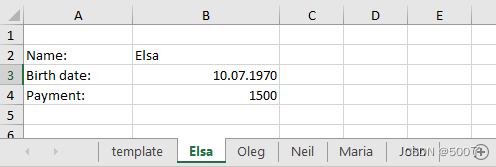
循环是用的最多的标签,用于循环输出各列数据:
jx:each(items="weeks" var="week" lastCell="B4")
示例:
public class Employee {
    private String name;
    private Date birthDate;
    private BigDecimal payment;
    private BigDecimal bonus;
    // getters/setters ...
    public Employee(String name, Date birthDate, double payment, double bonus) {
        this(name, birthDate, new BigDecimal(payment), new BigDecimal(bonus));
    }
     public String getSalaryGroup() {
        return payment.doubleValue() > 2000d ? "high" : "normal";
    }
}

 List<Employee> employees = new ArrayList<>();
 SimpleDateFormat dateFormat = new SimpleDateFormat("yyyy-MMM-dd", Locale.US);
 employees.add(new Employee("Elsa", dateFormat.parse("1970-Jul-10"), 1500, 0.15));
 employees.add(new Employee("Oleg", dateFormat.parse("1973-Apr-30"), 2300, 0.25));
 employees.add(new Employee("John", dateFormat.parse("1970-Jul-10"), 3500, 0.10));
 employees.add(new Employee("Neil", dateFormat.parse("1975-Oct-05"), 2500, 0.00));
 employees.add(new Employee("Maria", dateFormat.parse("1978-Jan-07"), 1700, 0.15));
 employees.add(new Employee("John", dateFormat.parse("1969-May-30"), 2800, 0.20));
 employees.add(new Employee("Oleg", dateFormat.parse("1988-Apr-30"), 1500, 0.15));
 employees.add(new Employee("Maria", dateFormat.parse("1970-Jul-10"), 3000, 0.10));
 employees.add(new Employee("John", dateFormat.parse("1973-Apr-30"), 1000, 0.05));
 return employees;
- multisheet 多sheet页
jx:each(items="employees" var="e" multisheet="sheetNames" lastCell="B4")
- 方向向右
默认值为 direction=“DOWN”,将创建行。将使用 direction=“RIGHT” 创建列。
您也可以为特殊情况设置自己的 cellRefGenerator,但在此不再进一步描述。
jx:each(items="e.departments" var="d" lastCell="D2" direction="RIGHT")
- 索引
有时我们需要显示循环的索引。使用属性 varIndex 指定将保存从 0 开始的迭代索引的变量名称。
jx:each(items="employees" var="e" varIndex="index" lastCell="C2")
- 过滤
只有选择条件为 true 的项才会成为输出的一部分。
jx:each(items="employees" var="e" select="e.payment > 2000" lastCell="C2")


5. 分组和分组排序
在属性中指定 var name + “.” + 属性名称以对项目进行分组。 还必须在属性中指定 ASC、DESC此时将在组内部进行排序。比如employee类中有salaryGroup(工资)方法来指定该人是否大于2000元。
示例代码:
jx:each(items="employees" var="g" groupBy="g.salaryGroup" groupOrder="ASC" lastCell="C3")
判断
jx:if 命令根据条件表达式显示/隐藏单元格。这就像 Java 中的 if 或 if,else。
jx:if(condition="e.payment<2000" lastCell="C2" areas=["A2:C2","A3:C3"])
condition:如果表达式结果为真,则显示区域,否则隐藏区域; 如果表达式结果不为 true,则显示其他区域,否则隐藏其他区域。


动态行列
jx:grid 命令可用于生成具有标题区域和数据行区域的动态网格。
jx:grid(headers="headers" data="items" areas=["A3:A3","A4:A4"] formatCells="BigDecimal:C1,Date:D1" lastCell="A4")
合并单元格
jx:mergeCells(cols="" rows="" minCols="" minRows="" lastCell="C2")
cols:组合列数,rows:合并的行数,minCols:要合并的最小列数,minRows:要合并的最小行数,lastCell:合并单元格范围。
图片
使用此命令将图像添加到工作表中。
jx:image(src="image" lastCell="A2")
src:返回包含图像数据的 byte[] 数组的表达式
imageType:可以包含以下值:PNG(默认值)、JPEG(非 JPG)、EMF、WMF、PICT、DIB。
scaleX:可选的 Double 值用于缩放scaleY
lastCell:区域结束
excel 公式处理
参数化公式允许在公式中使用变量,必须将其括在$[ ] 符号中,比如我们需要把数据输出的同时进行计算,比如我们数据中的比率值是1(excel上最终需要显示为1%)。我们可以修改代码为$[${item.taxRate}/100],其中${item.taxRate}表示我们自己的迭代变量,同时改变单元格样式为百分比,此时输出的值才会是1%


