- Jetson Orin NX Super安装TensorRT-LLM
u013250861
#LLM/部署&推理elasticsearch大数据搜索引擎
根据图片中显示的JetsonOrinNXSuper系统环境(JetPack6.2+CUDA12.6+TensorRT10.7),以下是针对该平台的TensorRT-LLM安装优化方案:一、环境适配调整基于你的实际配置:JetPack6.2(含CUDA12.6,TensorRT10.7)Python3.10.12aarch64架构需选择适配的TensorRT-LLM版本。由于官方预编译包可能未覆盖此
- SpringBoot多数据源动态切换方案:AbstractRoutingDataSource详解
fanxbl957
Webspringboot后端java
博主介绍:Java、Python、js全栈开发“多面手”,精通多种编程语言和技术,痴迷于人工智能领域。秉持着对技术的热爱与执着,持续探索创新,愿在此分享交流和学习,与大家共进步。DeepSeek-行业融合之万象视界(附实战案例详解100+)全栈开发环境搭建运行攻略:多语言一站式指南(环境搭建+运行+调试+发布+保姆级详解)感兴趣的可以先收藏起来,希望帮助更多的人SpringBoot多数据源动态切换
- 「源力觉醒 创作者计划」_以FastDeploy为例部署ERNIE-4.5-21B大模型全流程实践
cooldream2009
大模型基础AI技术文心大模型FastDeploy
目录前言1环境准备与依赖安装1.1硬件要求1.2Python环境与pip升级2下载ERNIE-4.5模型权重2.1安装HuggingFaceCLI工具2.2设置国内镜像加速(可选)2.3下载模型文件3安装FastDeploy与Paddle推理引擎3.1安装PaddlePaddle-GPU版本3.2安装FastDeploy-GPU4启动ERNIE-4.5本地服务4.1启动OpenAI兼容API服务4
- Python打卡:Day46
剑桥折刀s
python打卡python
importtorchimporttorch.nnasnnimporttorch.optimasoptimimporttorchvisionfromtorchvisionimportdatasets,transformsfromtorch.utils.dataimportDataLoaderfromtorch.utils.tensorboardimportSummaryWriterimportnu
- 为什么在 macOS 中运行 Python 项目必须使用虚拟环境?
coding随想
Pythonmacospython开发语言
为什么在macOS中运行Python项目必须使用虚拟环境?在macOS上开发Python项目时,虚拟环境(VirtualEnvironment)是一个不可或缺的工具。无论你是初学者还是资深开发者,理解虚拟环境的意义和使用方法,都是提升开发效率和项目稳定性的关键。本文将从macOS的特殊性出发,深入浅出地解释为什么在macOS中运行Python项目必须使用虚拟环境。一、macOS系统Python的局
- 扣子智能体5:使用Python异步执行工作流并获取执行结果
呆萌的代Ma
大模型python扣子
使用python异步执行工作流的步骤有3步:异步执行工作流,获取工作流的execute_id,之后就能根据这个id查询工作流的执行情况如果execute_id=“Success”,就表示工作流执行完毕执行完毕后,打印output,就是大模型最后的全部示例代码fromloguruimportloggerimportrequestsimportjsondefrun_coze_ai(coze_api_t
- MCP客户端请求MCP服务器资源的Python SDK实现
AI天才研究院
计算AI人工智能与大数据Python实战python开发语言ai服务器
我将为您提供一个详细的指南,说明如何使用PythonSDK让MCP客户端请求MCP服务器的资源。MCP客户端请求MCP服务器资源的PythonSDK实现核心概念ModelContextProtocol(MCP)是一个标准化协议,允许应用程序以标准化的方式为大语言模型(LLM)提供上下文,将提供上下文的关注点与实际的LLM交互分离。MCP中的资源(Resources)是一种核心原语,允许服务器暴露数
- python中提示‘pyinstaller‘ 不是内部或外部命令,也不是可运行的程序 或批处理文件。
一、出现这个问题的原因:来自于首先安装这个pyinstaller的时候,没有将D:\01_SoftWare\python3.9.13\Scripts或者D:\01_SoftWare\python3.9.13或者是D:\01_SoftWare\python3.9.13\Lib添加到环境变量中,那需要做的第一步就是添加下系统的环境变量。这样就可以了。到这里,可能一部分人,再次安装就好了,但是这边尝试看
- 第十篇:Python 进阶-内存管理
程序员勇哥
Python全套教程pythonjvm开发语言
第十篇:Python进阶-内存管理1.垃圾回收机制引用计数原理引用计数是Python垃圾回收机制中最基本的一种方式。其核心思想是:每个对象都维护一个引用计数,记录当前指向该对象的引用(变量)的数量。当对象的引用计数变为0时,意味着没有任何变量指向该对象,Python解释器会立即回收该对象所占用的内存空间。例如,考虑以下代码:a=[1,2,3]#创建一个列表对象,并将其引用赋值给变量a,此时列表对象
- Python 三方库 python-dotenv
wohu007
#标准库和三方库pythonpython-dotenv
1.简介在一些项目中,处于安全性的要求,一般不将密码,key等放入到配置文件中。然而这些代码又是上传在git等平台上。为了方便管理。一般采用系统变量的方式来实现。从而实现配置和代码分开。2.安装pipinstallpython-dotenv3.使用目录结构及代码.├──.env└──demo.py.env内容REDIS_HOST="127.0.0.1"PWD="/home/wohu"你可以使用单词
- Python自动化测试基础知识
心 一
Python自动化测试python开发语言
Python自动化测试基础知识一、自动化测试基础概念1.什么是自动化测试使用脚本和工具代替人工执行测试用例的过程通过编写代码来模拟用户操作,验证系统功能核心目标是提高测试效率,减少重复劳动2.自动化测试的优势高效率:可快速执行大量测试用例可重复:相同测试可反复执行,结果一致准确性:避免人为错误覆盖率:可执行难以手动测试的复杂场景持续集成:易于与CI/CD流程集成3.自动化测试的适用场景回归测试性能
- python进阶之数据结构与算法--入门-二叉树
小白piao
数据结构与算法python篇数据结构算法二叉树python
二叉树概念:之前已经提及了关于树的概念,要想知道之前讲了什么请关注,前边文章里都有提及。这里不做赘述。二叉树是具有以下属性的有序树:1、每个节点最多有两个孩子节点2、每个孩子节点被命名为左子节点和右子节点3、对于每个节点的孩子节点,在顺序上,左子节点优先于右子节点4、若子树的根为内部节点v的左子节点或者右子节点,则该子树相应地被称为节点v的左子树或者右子树5、若每个节点都有零个或者两个节点,则这样
- Python进阶 - 关键字 Global 和 Return
孤寒者
Python全栈系列教程pythonglobalreturn
目录:每篇前言:一、`return`的角色与机制二、`global`关键字与命名空间三、函数多值返回的高级模式四、`global`vs`nonlocal`vs返回值五、最佳实践与反模式总结每篇前言:作者介绍:【孤寒者】—CSDN全栈领域优质创作者、HDZ核心组成员、华为云享专家Python全栈领域博主、CSDN原力计划作者本文已收录于Python全栈系列教程专栏:《Python全栈系列教程》热门专
- Python Set() 完全指南:从入门到精通
2501_91537435
pythonpython开发语言
PythonSet()完全指南:从入门到精通Set(集合)是Python中一种非常有用的内置数据类型,它提供了高效的成员检测和消除重复元素的功能。本文将带你全面了解Python中的set(),从基础概念到高级用法。一、什么是Set?Set是Python中的一种无序、可变、不重复元素的集合数据类型。它类似于数学中的集合概念,支持并集、交集、差集等操作。#创建一个setfruits={'apple',
- 一文读懂Python+Pytest+Allure+Jenkins+Gitee自动化测试框架,手把手教你搭建
Python+Pytest+Allure+Jenkins+Gitee自动化测试框架一、框架整体架构1.技术栈分工Python:测试脚本开发语言Pytest:测试用例管理和执行引擎Allure:测试报告生成与展示Jenkins:持续集成和任务调度Gitee:代码版本管理和触发机制2.数据流向Gitee代码提交→Jenkins触发构建→Pytest执行用例→生成Allure结果→Jenkins收集报告
- 【vue】用conda配置nodejs,一键开通模版使用权
温择之
conda
特此鸣谢我的好同学@重中之重的特级教学,非常之好用一、conda环境下载安装二、创建包含nodejs的conda环境创建一个新环境:condacreate-n【自定义环境名字】python=3.9condacreate-nmy_nodejs_envpython=3.9激活新环境:condaactivate【环境名字】condaactivatemy_nodejs_env下载安装nodejs:cond
- 大模型API密钥的环境变量配置(大模型API KEY管理)(将密钥存储在环境变量)(python-dotenv)(密钥管理)环境变量设置环境变量
Dontla
大模型LLMpython开发语言
文章目录大模型API密钥的环境变量配置:安全与最佳实践引言安全风险代码泄露风险版本控制暴露环境变量的优势安全隔离跨环境一致性环境变量配置方法Linux/macOS配置Windows配置开发框架集成Node.js使用dotenvPython使用python-dotenv最佳实践.env文件管理环境变量模板容器环境配置安全增强措施密钥轮换机制秘密管理服务集成总结大模型API密钥的环境变量配置:安全与最
- 操作系统领域的新宠儿:鸿蒙应用深度剖析
操作系统内核探秘
操作系统内核揭秘harmonyos华为ai
操作系统领域的新宠儿:鸿蒙应用深度剖析关键词:鸿蒙操作系统、微内核架构、分布式软总线、ArkUI框架、DevEcoStudio、跨设备开发、全场景生态摘要:本文深度剖析华为鸿蒙操作系统的核心技术架构与应用开发体系,从微内核设计、分布式协同技术、UI框架创新到全场景开发工具链展开分析。通过数学模型解析分布式一致性算法,结合Python代码演示核心调度逻辑,并以实战案例演示跨设备应用开发流程。探讨鸿蒙
- NumPy-随机数生成详解
GG不是gg
numpynumpy
NumPy-随机数生成详解一、随机数生成的基础:伪随机数与种子1.伪随机数的本质2.种子的设置:确保结果可复现二、常用随机数生成函数1.均匀分布随机数2.正态分布随机数3.整数随机数4.其他常用分布三、随机数生成的进阶操作1.随机排列与洗牌2.控制随机数的维度与形状四、随机数生成的应用场景1.数据增强2.蒙特卡洛模拟3.随机初始化参数五、注意事项NumPy作为Python数值计算的核心库,提供了功
- python namedtuple转为dict
链池
python开发语言
python相关学习资料:搭建私人助理大模型需要什么环境?006_指法标准_键盘正位_你好世界_hello_world_单引号_双引号一张图生成指定动作的动态视频,MagicAnimate本地部署Pythonnamedtuple转为dict的方法作为一名经验丰富的开发者,我很高兴能够帮助刚入行的小白们解决编程问题。今天,我们将一起学习如何将Python中的namedtuple转换为dict。这个过
- Python namedtuple 详解:作用与使用方法
文章目录一、什么是namedtuple主要特点:二、namedtuple的作用1.替代普通元组,提高代码可读性2.替代简单类,减少样板代码3.作为轻量级数据结构三、基本使用方法1.创建namedtuple类型2.创建实例3.访问字段4.不可变性测试四、高级特性与方法1._asdict()-转换为有序字典2._replace()-创建新实例并替换字段3._fields-查看字段名4._make()-
- 探秘`nanomsg-python`: Python中的高效通信库
探秘nanomsg-python:Python中的高效通信库nanomsg-pythonnanomsgwrapperforpythonwithmultiplebackends(CPythonandctypes)shouldsupport2/3andPypy项目地址:https://gitcode.com/gh_mirrors/na/nanomsg-python在Python的世界里,找到一个既能满
- Springboot和Python之间通过RabbitMQ进行双向异步消息交互demo示例
同心圆码农
后端java-rabbitmqspringbootpython
SpringBoot后端和Python算法之间解耦设计,采用通过消息总线RabbitMQ进行双向异步交互,以下是一个demo样例,罗列出了实现该功能需要做的工作,包括软件安装、RabbitMQ基本介绍、Springboot后端demo代码、Pythondemo代码、运行流程以及调试遇到问题软件安装Win10本地需要安装RabbitMQ,作为Springboot后端和Python模块通讯的消息中间件
- Python词法分析器:从概念到实践
凡狗蛋
本文还有配套的精品资源,点击获取简介:Python词法分析器是编程语言处理的关键环节,负责将源代码解析为有意义的标记或符号序列。本简介详细介绍了词法分析、正则表达式、分词、词法规则、词法分析器生成器以及编译原理等核心概念,并展示了如何使用Python内置的re模块和第三方库ply实现词法分析器,为进一步理解编程语言的工作原理和构建自定义编程语言打下基础。1.词法分析器的作用与目的词法分析器是编译器
- Python打卡:Day27
剑桥折刀s
python打卡python
deflogger(func):defwrapper(*args,**kwargs):#打印函数开始执行的日志print(f"开始执行函数:{func.__name__}")print(f"参数:args={args},kwargs={kwargs}")#执行原函数并获取返回值result=func(*args,**kwargs)#打印函数执行结束的日志print(f"函数{func.__name
- 【Python进阶篇 面向对象程序设计(5) 异常处理】
nananaij
pythonpycharm开发语言
文章目录1、基础异常类(所有异常的父类)2、异常类型总结3、异常处理(1)try......except语句:捕获和处理异常(2)try......except......else语句(3)try......except......finally语句(4)raise语句(5)assert语句:调试断言1、基础异常类(所有异常的父类)BaseException:所有内置异常的基类(不建议直接捕获)。
- 【Python入门与进阶】Python面向对象编程练习
小龙
python面向对象编程练习
练习题1:定义一个Person类定义一个Person类,它有以下属性和方法:属性:name(字符串):表示人的名字。age(整数):表示人的年龄。方法:__init__(self,name,age):构造方法,用于初始化name和age。greet(self):打印Hello,mynameis[name]andIam[age]yearsold.classPerson:def__init__(sel
- Docker部署项目无法访问,登录超时完整排查攻略
Orlando chrono
DevOpsnginx服务器运维
项目背景:迁移前后端应用,prod环境要求保留443端口,开发环境37800端口,后端容器端口为8000,前端为80,fastAPI对外端口为41000生产环境部署在VM01,开发环境部署在VM03,在VM01配置nginx转发[
[email protected]]#dockerps|grepmig73fbafgc2811mig_backend-buildnum3"python./main.py"5d
- 创意 Python 爱心代码
在编程的世界里,我们不仅可以解决复杂的问题,还能用代码表达情感。今天,我们来分享几段有趣的Python代码,通过绘制爱心图案,展示Python的创意与技术魅力。1.使用Matplotlib画爱心importnumpyasnpimportmatplotlib.pyplotasplt#生成心形曲线的数据t=np.linspace(0,2*np.pi,1000)x=16*np.sin(t)**3y=13
- Effective Python 条款4:用支持插值的f-string取代C风格的格式字符串与str.format方法
郝学胜-神的一滴
PythonEffectivePythonpython开发语言程序人生
在Python开发中,字符串格式化是日常操作的核心功能。本文将深入解析三种主流方法,并通过对比表格助你选择最佳方案。三种方法快速概览特性%格式化str.format()f-stringPython版本要求所有版本≥2.6≥3.6可读性低中高执行速度慢中等最快变量复用需重复写入需重复写入单点定义表达式支持不支持有限支持完整支持类型安全低中高字典/对象访问冗余较清晰最简洁%格式化-C语言风格的遗产na
- xml解析
小猪猪08
xml
1、DOM解析的步奏
准备工作:
1.创建DocumentBuilderFactory的对象
2.创建DocumentBuilder对象
3.通过DocumentBuilder对象的parse(String fileName)方法解析xml文件
4.通过Document的getElem
- 每个开发人员都需要了解的一个SQL技巧
brotherlamp
linuxlinux视频linux教程linux自学linux资料
对于数据过滤而言CHECK约束已经算是相当不错了。然而它仍存在一些缺陷,比如说它们是应用到表上面的,但有的时候你可能希望指定一条约束,而它只在特定条件下才生效。
使用SQL标准的WITH CHECK OPTION子句就能完成这点,至少Oracle和SQL Server都实现了这个功能。下面是实现方式:
CREATE TABLE books (
id &
- Quartz——CronTrigger触发器
eksliang
quartzCronTrigger
转载请出自出处:http://eksliang.iteye.com/blog/2208295 一.概述
CronTrigger 能够提供比 SimpleTrigger 更有具体实际意义的调度方案,调度规则基于 Cron 表达式,CronTrigger 支持日历相关的重复时间间隔(比如每月第一个周一执行),而不是简单的周期时间间隔。 二.Cron表达式介绍 1)Cron表达式规则表
Quartz
- Informatica基础
18289753290
InformaticaMonitormanagerworkflowDesigner
1.
1)PowerCenter Designer:设计开发环境,定义源及目标数据结构;设计转换规则,生成ETL映射。
2)Workflow Manager:合理地实现复杂的ETL工作流,基于时间,事件的作业调度
3)Workflow Monitor:监控Workflow和Session运行情况,生成日志和报告
4)Repository Manager:
- linux下为程序创建启动和关闭的的sh文件,scrapyd为例
酷的飞上天空
scrapy
对于一些未提供service管理的程序 每次启动和关闭都要加上全部路径,想到可以做一个简单的启动和关闭控制的文件
下面以scrapy启动server为例,文件名为run.sh:
#端口号,根据此端口号确定PID
PORT=6800
#启动命令所在目录
HOME='/home/jmscra/scrapy/'
#查询出监听了PORT端口
- 人--自私与无私
永夜-极光
今天上毛概课,老师提出一个问题--人是自私的还是无私的,根源是什么?
从客观的角度来看,人有自私的行为,也有无私的
- Ubuntu安装NS-3 环境脚本
随便小屋
ubuntu
将附件下载下来之后解压,将解压后的文件ns3environment.sh复制到下载目录下(其实放在哪里都可以,就是为了和我下面的命令相统一)。输入命令:
sudo ./ns3environment.sh >>result
这样系统就自动安装ns3的环境,运行的结果在result文件中,如果提示
com
- 创业的简单感受
aijuans
创业的简单感受
2009年11月9日我进入a公司实习,2012年4月26日,我离开a公司,开始自己的创业之旅。
今天是2012年5月30日,我忽然很想谈谈自己创业一个月的感受。
当初离开边锋时,我就对自己说:“自己选择的路,就是跪着也要把他走完”,我也做好了心理准备,准备迎接一次次的困难。我这次走出来,不管成败
- 如何经营自己的独立人脉
aoyouzi
如何经营自己的独立人脉
独立人脉不是父母、亲戚的人脉,而是自己主动投入构造的人脉圈。“放长线,钓大鱼”,先行投入才能产生后续产出。 现在几乎做所有的事情都需要人脉。以银行柜员为例,需要拉储户,而其本质就是社会人脉,就是社交!很多人都说,人脉我不行,因为我爸不行、我妈不行、我姨不行、我舅不行……我谁谁谁都不行,怎么能建立人脉?我这里说的人脉,是你的独立人脉。 以一个普通的银行柜员
- JSP基础
百合不是茶
jsp注释隐式对象
1,JSP语句的声明
<%! 声明 %> 声明:这个就是提供java代码声明变量、方法等的场所。
表达式 <%= 表达式 %> 这个相当于赋值,可以在页面上显示表达式的结果,
程序代码段/小型指令 <% 程序代码片段 %>
2,JSP的注释
<!-- -->
- web.xml之session-config、mime-mapping
bijian1013
javaweb.xmlservletsession-configmime-mapping
session-config
1.定义:
<session-config>
<session-timeout>20</session-timeout>
</session-config>
2.作用:用于定义整个WEB站点session的有效期限,单位是分钟。
mime-mapping
1.定义:
<mime-m
- 互联网开放平台(1)
Bill_chen
互联网qq新浪微博百度腾讯
现在各互联网公司都推出了自己的开放平台供用户创造自己的应用,互联网的开放技术欣欣向荣,自己总结如下:
1.淘宝开放平台(TOP)
网址:http://open.taobao.com/
依赖淘宝强大的电子商务数据,将淘宝内部业务数据作为API开放出去,同时将外部ISV的应用引入进来。
目前TOP的三条主线:
TOP访问网站:open.taobao.com
ISV后台:my.open.ta
- 【MongoDB学习笔记九】MongoDB索引
bit1129
mongodb
索引
可以在任意列上建立索引
索引的构造和使用与传统关系型数据库几乎一样,适用于Oracle的索引优化技巧也适用于Mongodb
使用索引可以加快查询,但同时会降低修改,插入等的性能
内嵌文档照样可以建立使用索引
测试数据
var p1 = {
"name":"Jack",
"age&q
- JDBC常用API之外的总结
白糖_
jdbc
做JAVA的人玩JDBC肯定已经很熟练了,像DriverManager、Connection、ResultSet、Statement这些基本类大家肯定很常用啦,我不赘述那些诸如注册JDBC驱动、创建连接、获取数据集的API了,在这我介绍一些写框架时常用的API,大家共同学习吧。
ResultSetMetaData获取ResultSet对象的元数据信息
- apache VelocityEngine使用记录
bozch
VelocityEngine
VelocityEngine是一个模板引擎,能够基于模板生成指定的文件代码。
使用方法如下:
VelocityEngine engine = new VelocityEngine();// 定义模板引擎
Properties properties = new Properties();// 模板引擎属
- 编程之美-快速找出故障机器
bylijinnan
编程之美
package beautyOfCoding;
import java.util.Arrays;
public class TheLostID {
/*编程之美
假设一个机器仅存储一个标号为ID的记录,假设机器总量在10亿以下且ID是小于10亿的整数,假设每份数据保存两个备份,这样就有两个机器存储了同样的数据。
1.假设在某个时间得到一个数据文件ID的列表,是
- 关于Java中redirect与forward的区别
chenbowen00
javaservlet
在Servlet中两种实现:
forward方式:request.getRequestDispatcher(“/somePage.jsp”).forward(request, response);
redirect方式:response.sendRedirect(“/somePage.jsp”);
forward是服务器内部重定向,程序收到请求后重新定向到另一个程序,客户机并不知
- [信号与系统]人体最关键的两个信号节点
comsci
系统
如果把人体看做是一个带生物磁场的导体,那么这个导体有两个很重要的节点,第一个在头部,中医的名称叫做 百汇穴, 另外一个节点在腰部,中医的名称叫做 命门
如果要保护自己的脑部磁场不受到外界有害信号的攻击,最简单的
- oracle 存储过程执行权限
daizj
oracle存储过程权限执行者调用者
在数据库系统中存储过程是必不可少的利器,存储过程是预先编译好的为实现一个复杂功能的一段Sql语句集合。它的优点我就不多说了,说一下我碰到的问题吧。我在项目开发的过程中需要用存储过程来实现一个功能,其中涉及到判断一张表是否已经建立,没有建立就由存储过程来建立这张表。
CREATE OR REPLACE PROCEDURE TestProc
IS
fla
- 为mysql数据库建立索引
dengkane
mysql性能索引
前些时候,一位颇高级的程序员居然问我什么叫做索引,令我感到十分的惊奇,我想这绝不会是沧海一粟,因为有成千上万的开发者(可能大部分是使用MySQL的)都没有受过有关数据库的正规培训,尽管他们都为客户做过一些开发,但却对如何为数据库建立适当的索引所知较少,因此我起了写一篇相关文章的念头。 最普通的情况,是为出现在where子句的字段建一个索引。为方便讲述,我们先建立一个如下的表。
- 学习C语言常见误区 如何看懂一个程序 如何掌握一个程序以及几个小题目示例
dcj3sjt126com
c算法
如果看懂一个程序,分三步
1、流程
2、每个语句的功能
3、试数
如何学习一些小算法的程序
尝试自己去编程解决它,大部分人都自己无法解决
如果解决不了就看答案
关键是把答案看懂,这个是要花很大的精力,也是我们学习的重点
看懂之后尝试自己去修改程序,并且知道修改之后程序的不同输出结果的含义
照着答案去敲
调试错误
- centos6.3安装php5.4报错
dcj3sjt126com
centos6
报错内容如下:
Resolving Dependencies
--> Running transaction check
---> Package php54w.x86_64 0:5.4.38-1.w6 will be installed
--> Processing Dependency: php54w-common(x86-64) = 5.4.38-1.w6 for
- JSONP请求
flyer0126
jsonp
使用jsonp不能发起POST请求。
It is not possible to make a JSONP POST request.
JSONP works by creating a <script> tag that executes Javascript from a different domain; it is not pos
- Spring Security(03)——核心类简介
234390216
Authentication
核心类简介
目录
1.1 Authentication
1.2 SecurityContextHolder
1.3 AuthenticationManager和AuthenticationProvider
1.3.1 &nb
- 在CentOS上部署JAVA服务
java--hhf
javajdkcentosJava服务
本文将介绍如何在CentOS上运行Java Web服务,其中将包括如何搭建JAVA运行环境、如何开启端口号、如何使得服务在命令执行窗口关闭后依旧运行
第一步:卸载旧Linux自带的JDK
①查看本机JDK版本
java -version
结果如下
java version "1.6.0"
- oracle、sqlserver、mysql常用函数对比[to_char、to_number、to_date]
ldzyz007
oraclemysqlSQL Server
oracle &n
- 记Protocol Oriented Programming in Swift of WWDC 2015
ningandjin
protocolWWDC 2015Swift2.0
其实最先朋友让我就这个题目写篇文章的时候,我是拒绝的,因为觉得苹果就是在炒冷饭, 把已经流行了数十年的OOP中的“面向接口编程”还拿来讲,看完整个Session之后呢,虽然还是觉得在炒冷饭,但是毕竟还是加了蛋的,有些东西还是值得说说的。
通常谈到面向接口编程,其主要作用是把系统��设计和具体实现分离开,让系统的每个部分都可以在不影响别的部分的情况下,改变自身的具体实现。接口的设计就反映了系统
- 搭建 CentOS 6 服务器(15) - Keepalived、HAProxy、LVS
rensanning
keepalived
(一)Keepalived
(1)安装
# cd /usr/local/src
# wget http://www.keepalived.org/software/keepalived-1.2.15.tar.gz
# tar zxvf keepalived-1.2.15.tar.gz
# cd keepalived-1.2.15
# ./configure
# make &a
- ORACLE数据库SCN和时间的互相转换
tomcat_oracle
oraclesql
SCN(System Change Number 简称 SCN)是当Oracle数据库更新后,由DBMS自动维护去累积递增的一个数字,可以理解成ORACLE数据库的时间戳,从ORACLE 10G开始,提供了函数可以实现SCN和时间进行相互转换;
用途:在进行数据库的还原和利用数据库的闪回功能时,进行SCN和时间的转换就变的非常必要了;
操作方法: 1、通过dbms_f
- Spring MVC 方法注解拦截器
xp9802
spring mvc
应用场景,在方法级别对本次调用进行鉴权,如api接口中有个用户唯一标示accessToken,对于有accessToken的每次请求可以在方法加一个拦截器,获得本次请求的用户,存放到request或者session域。
python中,之前在python flask中可以使用装饰器来对方法进行预处理,进行权限处理
先看一个实例,使用@access_required拦截:
?
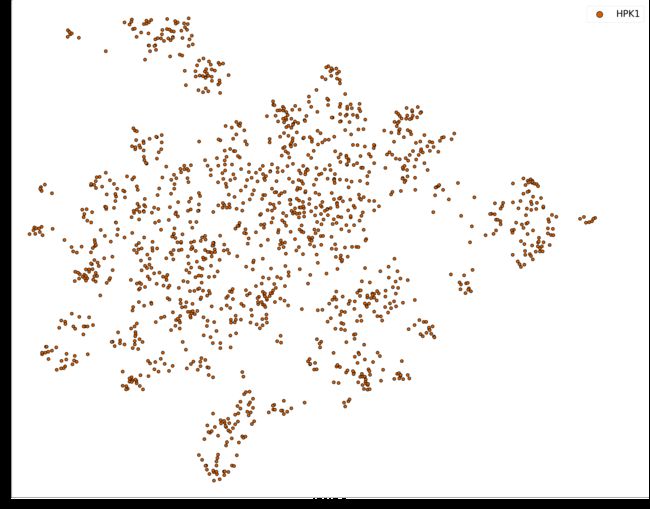
 可用于对比不同数据集的化学空间,以下是三个数据集化学空间的分布图