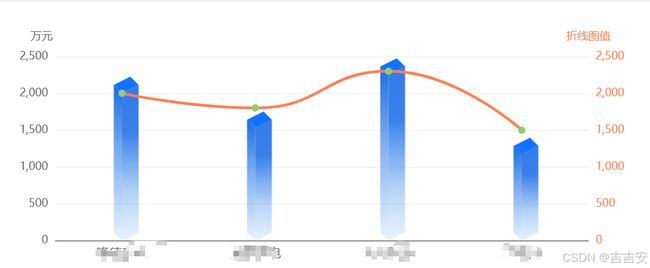
使用echarts实现3d柱状图+折线图
以下代码有问题请直接问国内直连GPT/Claude
HTML
需要注意threeDchart一定要设置宽度高度,不然图不显示,然后echarts版本不要太低,不然也不显示
<div id="threeDchart" class="threeDchart">div>
js
set3DBarChart2(data) {
var myChart = echarts.init(document.getElementById('middle-right-top-chart'));
data = [2000, 1529, 2251, 1173];
const CubeLeft = echarts.graphic.extendShape({
shape: {
x: 0,
y: 0,
},
buildPath: function (ctx, shape) {
const xAxisPoint = shape.xAxisPoint;
const c0 = [shape.x, shape.y];
const c1 = [shape.x - 9, shape.y - 9];
const c2 = [xAxisPoint[0] - 9, xAxisPoint[1] - 9];
const c3 = [xAxisPoint[0], xAxisPoint[1]];
ctx.moveTo(c0[0], c0[1]).lineTo(c1[0], c1[1]).lineTo(c2[0], c2[1]).lineTo(c3[0], c3[1]).closePath();
},
});
const CubeRight = echarts.graphic.extendShape({
shape: {
x: 0,
y: 0,
},
buildPath: function (ctx, shape) {
const xAxisPoint = shape.xAxisPoint;
const c1 = [shape.x, shape.y];
const c2 = [xAxisPoint[0], xAxisPoint[1]];
const c3 = [xAxisPoint[0] + 18, xAxisPoint[1] - 9];
const c4 = [shape.x + 18, shape.y - 9];
ctx.moveTo(c1[0], c1[1]).lineTo(c2[0], c2[1]).lineTo(c3[0], c3[1]).lineTo(c4[0], c4[1]).closePath();
},
});
const CubeTop = echarts.graphic.extendShape({
shape: {
x: 0,
y: 0,
},
buildPath: function (ctx, shape) {
const c1 = [shape.x, shape.y];
const c2 = [shape.x + 18, shape.y - 9];
const c3 = [shape.x + 9, shape.y - 18];
const c4 = [shape.x - 9, shape.y - 9];
ctx.moveTo(c1[0], c1[1]).lineTo(c2[0], c2[1]).lineTo(c3[0], c3[1]).lineTo(c4[0], c4[1]).closePath();
},
});
echarts.graphic.registerShape('CubeLeft', CubeLeft);
echarts.graphic.registerShape('CubeRight', CubeRight);
echarts.graphic.registerShape('CubeTop', CubeTop);
let option = {
grid: {
left: '3%',
right: '4%',
bottom: '3%',
containLabel: true,
},
tooltip: {
trigger: 'item',
formatter: (params) => {
let markerArr = params.marker.split('color:');
let marker = markerArr[0] + 'color:#1472FF;">';
dataStr =
`
${params.name}
` +
marker +
`合同金额` +
`${params.data}万元` +
``;
return dataStr;
},
},
xAxis: {
type: 'category',
data: ['隆德矿业', '榆横煤电', '锦兴能源', '不连沟'],
axisTick: {
show: false, // 不显示坐标轴刻度线
},
axisPoint: {
type: 'shadow',
},
axisLabel: {
textStyle: {
color: '#666666',
fontSize: '14',
},
},
},
yAxis: [
{
type: 'value',
min: 0,
name: '万元',
splitLine: {
show: true,
lineStyle: {
color: '#F0F0F0',
},
},
nameTextStyle: {
color: '#666666',
padding: [0, 30, 0, 0],
},
axisLabel: {
color: '#666666',
},
},
// 右侧纵向坐标轴
{
type: 'value',
name: '折线图值',
position: 'right', // 右侧显示
splitLine: {
show: false, // 不显示右侧坐标轴的分隔线
},
axisLabel: {
color: '#FF7F50',
},
nameTextStyle: {
color: '#FF7F50',
},
}
],
series: [
// 3D柱状图
{
type: 'custom',
renderItem: function (params, api) {
const location = api.coord([api.value(0), api.value(1)]);
return {
type: 'group',
children: [
{
type: 'CubeLeft',
shape: {
api,
xValue: api.value(0),
yValue: api.value(1),
x: location[0],
y: location[1],
xAxisPoint: api.coord([api.value(0), 0]),
},
style: {
fill: new echarts.graphic.LinearGradient(0, 0, 0, 1, [
{
offset: 0,
color: '#1D6CE2',
},
{
offset: 1,
color: 'rgba(51, 135, 234, 0.10)',
},
]),
},
},
{
type: 'CubeRight',
shape: {
api,
xValue: api.value(0),
yValue: api.value(1),
x: location[0],
y: location[1],
xAxisPoint: api.coord([api.value(0), 0]),
},
style: {
fill: new echarts.graphic.LinearGradient(0, 0, 0, 1, [
{
offset: 0,
color: 'rgba(51, 124, 234, 1)',
},
{
offset: 0.3,
color: 'rgba(51, 124, 234, 0.97)',
},
{
offset: 0.7,
color: 'rgba(51, 135, 234, 0.36)',
},
{
offset: 1,
color: 'rgba(51, 143, 234, 0.10)',
},
]),
},
},
{
type: 'CubeTop',
shape: {
api,
xValue: api.value(0),
yValue: api.value(1),
x: location[0],
y: location[1],
xAxisPoint: api.coord([api.value(0), 0]),
},
style: {
fill: '#1472FF',
},
},
],
};
},
data: data,
},
// 折线图
{
type: 'line',
name: '折线图',
smooth: true, // 平滑曲线
data: [2000, 1800, 2300, 1500], // 你可以根据实际数据修改这个数组
lineStyle: {
color: '#FF7F50',
width: 3,
},
symbol: 'circle', // 设置折线图标记为圆形
symbolSize: 8, // 设置圆形标记的大小
yAxisIndex: 1, // 使用右侧的 y 轴
},
],
};
myChart.setOption(option);
window.addEventListener('resize', function () {
myChart.resize();
});
},