import matplotlib.pyplot as plt
from sklearn.cluster import KMeans
import numpy as np
class1_points = np.array([[1.9, 1.2],
[1.5, 2.1],
[1.9, 0.5],
[1.5, 0.9],
[0.9, 1.2],
[1.1, 1.7],
[1.4, 1.1]])
class2_points = np.array([[-1.9, 1.2],
[-1.5, 2.1],
[-1.9, 0.5],
[-1.5, 0.9],
[-0.9, 1.2],
[-1.1, 1.7],
[-1.4, 1.1]])
class3_points = np.array([[1.9, -1.2],
[1.5, -2.1],
[1.9, -0.5],
[1.5, -0.9],
[0.9, -1.2],
[1.1, -1.7],
[1.4, -1.1]])
class4_points = np.array([[-1.9, -1.2],
[-1.5, -2.1],
[-1.9, -0.5],
[-1.5, -0.9],
[-0.9, -1.2],
[-1.1, -1.7],
[-1.4, -1.1]])
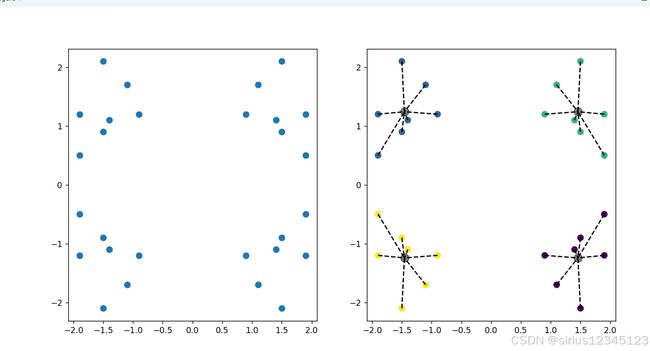
data = np.concatenate((class1_points, class2_points, class3_points, class4_points))
fig, (ax1, ax2) = plt.subplots(1, 2, figsize=(12, 6))
k = 4
ax1.scatter(data[:, 0], data[:, 1], s=50)
ax1.plot()
km = KMeans(n_clusters=k,max_iter=30)
km.fit(data)
centers = km.cluster_centers_
y_kmeans = km.predict(data)
print(y_kmeans)
for i in range(k):
cluster_points = data[y_kmeans == i]
centroid = centers[i]
for cluster_points in cluster_points:
ax2.plot([cluster_points[0], centroid[0]],[cluster_points[1], centroid[1]],'k--')
ax2.scatter(data[:, 0], data[:, 1], c = y_kmeans, s=50)
ax2.scatter(centers[:, 0], centers[:, 1], c='black', s=100, alpha=0.5)
plt.show()