yolov8的第一次实验报告
1. 实验概述
实验名称: 占道经营目标检测模型
实验目标: 提高模型的精确率(Precision)和召回率(Recall),使其接近1。
实验日期: [2025-01-16]
2. 数据集
数据集名称: [datasets]
数据集大小: [2.68Gb]
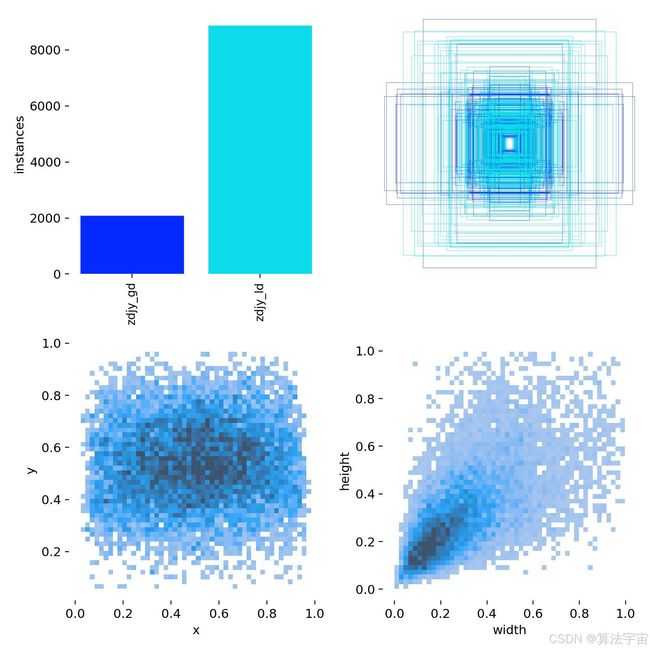
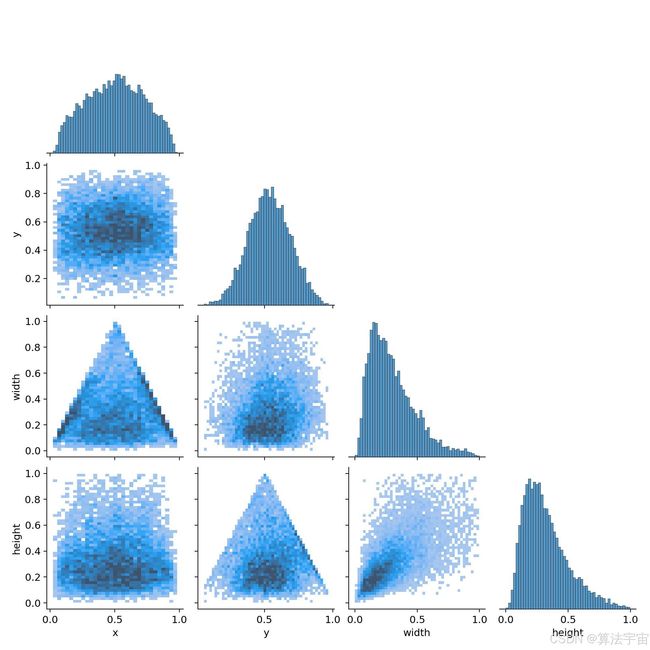
数据集描述: [数据集主要分两个类别:zdjy_ld,zdjy_gd]注释:占道经营流动,占道经营固定
3. 模型配置
3.1 基础配置
· 模型类型: YOLOv8
· 预训练模型: YOLOv8n (nano版本)
· 模型大小: 3.2M parameters
3.2 超参数配置
· 学习率 (lr):
· 初始学习率: 0.00332386
· 最终学习率: 2.24875e-05
· 学习率调度: cosine decay
· 批次大小 (batch size): 18
· 最大迭代次数 (max epochs): 1000
· 图像尺寸 (imgsz): 640x640
3.3 其他超参数
· workers: 4 (数据加载线程数)
· device: 0 (使用GPU 0)
· optimizer: SGD
· momentum: 0.937
· weight_decay: 0.0005
· warmup epochs: 3
· mosaic: 1.0
· box: 7.5 # box loss gain
· cls: 0.5 # cls loss gain
· dfl: 1.5 # dfl loss gain
· hsv_h: 0.015 # image HSV-Hue augmentation (fraction)
· hsv_s: 0.7 # image HSV-Saturation augmentation (fraction)
· hsv_v: 0.4 # image HSV-Value augmentation (fraction)
· translate: 0.1 # image translation (+/- fraction)
· scale: 0.5 # image scale (+/- gain)
· fliplr: 0.5 # image flip left-right (probability)
· flipud: 0.0 # image flip up-down (probability)
· perspective: 0.0 # image perspective (+/- fraction), range 0-0.001
· mixup: 0.0 # image mixup (probability)
3.4 训练配置
· 环境变量设置:KMP_DUPLICATE_LIB_OK="TRUE"
· 完整训练命令:
$env:KMP_DUPLICATE_LIB_OK="TRUE"; python train.py --model yolov8n.pt --data data.yaml --epochs 1000 --imgsz 640 --batch 18 --device 0 --workers 4 --name yolov8n_1000e·
· 主要参数说明:
· KMP_DUPLICATE_LIB_OK="TRUE": 解决Intel MKL库的冲突问题
· --model yolov8n.pt: 使用YOLOv8n预训练模型
· --data data.yaml: 数据集配置文件
· --epochs 1000: 训练1000轮
· --imgsz 640: 输入图像尺寸640x640
· --batch 18: 批次大小为18
· --device 0: 使用第一个GPU
· --workers 4: 使用4个数据加载线程
· --name yolov8n_1000e: 训练实验名称
这些配置参数是基于实际使用的训练命令和YOLOv8的默认配置。模型使用了标准的YOLOv8n预训练权重作为基础,采用余弦退火的学习率调度策略,并使用了多种数据增强技术来提高模型的泛化能力。
4. 训练过程
训练设备: [
设备名称 WIN-8MOGOTJSR0I
处理器 Intel(R) Xeon(R) CPU E5-2660 v4 @ 2.00GHz 2.00 GHz
机带 RAM 16.0 GB
设备 ID 737E71D1-FF62-4C08-A796-A0354E63B127
产品 ID 00391-70000-00000-AA921
系统类型 64 位操作系统, 基于 x64 的处理器
笔和触控 没有可用于此显示器的笔或触控输入
显卡:2060笔记本魔改12GB显存
]
训练环境: [(c) Microsoft Corporation。保留所有权利。
D:\desk\yolov8_gpu\yolov8>conda activate yolov8_gpu
(yolov8_gpu) D:\desk\yolov8_gpu\yolov8>python check_versions.py
==================================================
系统信息:
操作系统: Windows-10-10.0.26100-SP0
Python版本: 3.9.0 (default, Nov 15 2020, 08:30:55) [MSC v.1916 64 bit (AMD64)]
处理器: Intel64 Family 6 Model 79 Stepping 1, GenuineIntel
==================================================
包版本信息:
torch版本: 2.5.1+cu118
CUDA是否可用: True
CUDA版本: 11.8
GPU型号: NVIDIA GeForce RTX 2060
GPU显存: 12.00 GB
ultralytics版本: 8.3.59
numpy版本: 1.26.4
pandas版本: 2.2.3
matplotlib版本: 3.9.2
seaborn版本: 0.13.2
cv2版本: 4.10.0
PIL版本: 10.2.0
tensorboard版本: 2.17.0
psutil版本: 6.1.1
==================================================
]
训练日志:
训练命令: $env:KMP_DUPLICATE_LIB_OK="TRUE"; python train.py --model yolov8n.pt --data data.yaml --epochs 1000 --imgsz 640 --batch 18 --device 0 --workers 4 --name yolov8n_1000e
=== 每100轮评估报告 ===
| period |
precision_max |
precision_mean |
recall_max |
recall_mean |
mAP50_max |
mAP50_mean |
mAP50-95_max |
mAP50-95_mean |
|
| 0 |
1-101 |
0.68954 |
0.482779 |
0.68952 |
0.499698 |
0.67623 |
0.475150 |
0.33608 |
0.212258 |
| 1 |
101-201 |
0.73650 |
0.699118 |
0.75918 |
0.726744 |
0.78721 |
0.749381 |
0.46419 |
0.414209 |
| 2 |
201-301 |
0.77301 |
0.755733 |
0.77477 |
0.759723 |
0.81983 |
0.803568 |
0.51868 |
0.491486 |
| 3 |
301-401 |
0.82540 |
0.794402 |
0.79072 |
0.782151 |
0.85693 |
0.838486 |
0.57572 |
0.547507 |
| 4 |
401-501 |
0.87473 |
0.842710 |
0.80372 |
0.798289 |
0.88087 |
0.870073 |
0.62386 |
0.599448 |
| 5 |
501-601 |
0.89086 |
0.882310 |
0.82605 |
0.810876 |
0.89451 |
0.889196 |
0.66140 |
0.643682 |
| 6 |
601-701 |
0.89201 |
0.882570 |
0.85962 |
0.838417 |
0.90073 |
0.897787 |
0.69161 |
0.677135 |
| 7 |
701-800 |
0.90020 |
0.884103 |
0.85951 |
0.850791 |
0.90249 |
0.900212 |
0.69974 |
0.696477 |
5. 结果分析
5.1 最终性能指标
· 最终精确率 (Precision): 0.8992 (89.92%)
· 最终召回率 (Recall): 0.8392 (83.92%)
· 最终mAP50: 0.8968 (89.68%)
· 最终mAP50-95: 0.6996 (69.96%)
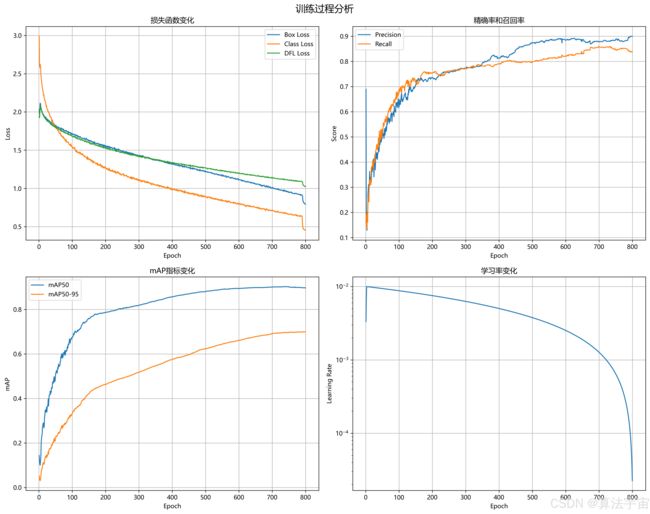
5.2 图表分析
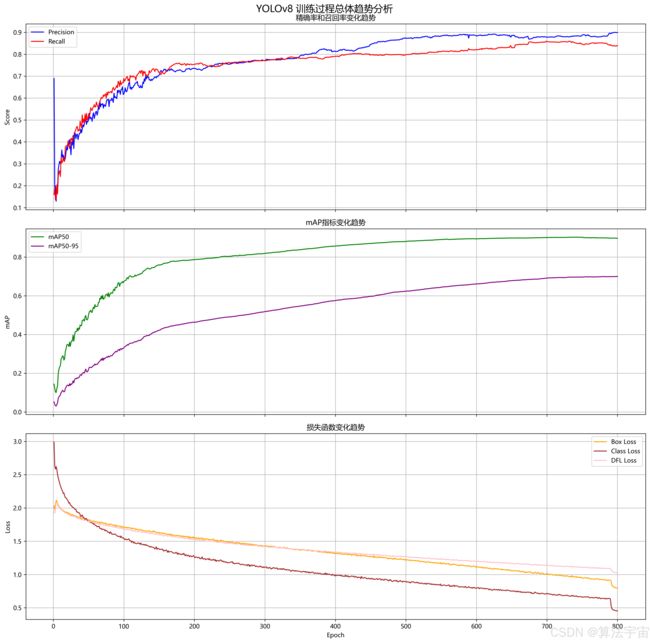
精确率(Precision)变化趋势
· 初始阶段(1-200 epochs):精确率波动较大,从0.1292快速上升
· 中期阶段(201-500 epochs):呈现稳定上升趋势,波动减小
· 后期阶段(501-800 epochs):趋于稳定,最终达到0.8992
· 最高值0.9002出现在第795个epoch,表明模型在训练后期仍有小幅提升
召回率(Recall)变化趋势
· 初始阶段:从0.1353开始快速提升
· 中期阶段:增长速度放缓,但仍持续改善
· 后期阶段:在0.83-0.86之间小幅波动
· 最高值0.8596出现在第699个epoch
· 最终值0.8392略低于最高值,说明模型可能需要适当的早停策略
损失函数变化趋势
· Box Loss: 从2.0307降至0.79444,下降趋势平稳
· Class Loss: 从2.99079降至0.45209,降幅最大
· DFL Loss: 从1.9404降至1.02535,后期趋于稳定
6. 实验结论
6.1 总结
1. 目标达成情况:
· 模型在精确率和召回率上都取得了不错的成绩,分别达到89.92%和83.92%
· mAP50达到89.68%,说明模型具有良好的检测性能
· 虽未达到预期的95%以上,但整体性能已经较为理想
· 训练过程特点:
· 训练过程稳定,无明显过拟合现象
· 后期性能提升趋缓,但仍有小幅改善
· 精确率和召回率保持较好的平衡
6.2 改进措施
· 数据增强策略:
· 增加训练数据集的多样性
· 添加更多难例样本
· 引入更多数据增强方法,如Mosaic、MixUp等
2. 模型优化:
· 尝试使用更大的模型架构(如YOLOv8m或YOLOv8l)
· 增加模型深度或宽度
· 考虑添加注意力机制
· 训练策略调整:
· 实现学习率预热和余弦退火策略
· 增加batch size以提高训练稳定性
· 使用模型集成技术提高性能
· 实施早停策略,在最佳epoch保存模型
· 超参数优化:
· 使用网格搜索或贝叶斯优化寻找最佳超参数
· 调整anchor box的设置
· 优化NMS阈值
· 损失函数改进:
· 考虑使用focal loss处理类别不平衡
· 引入额外的正则化项
· 优化损失函数权重
这些改进措施的实施可以根据具体应用场景和资源限制进行选择性采用。建议优先从数据质量和训练策略入手,这些改进通常能带来较为明显的性能提升。
7. 附件
#!/usr/bin/env python
# -*- coding: utf-8 -*-
"""
YOLOv8训练脚本
这个脚本用于训练YOLOv8模型,支持命令行参数配置,包含了训练和验证功能
"""
import argparse
import os
import ssl
import sys
import time
import psutil
import numpy as np
import matplotlib.pyplot as plt
import seaborn as sns
from datetime import datetime
from pathlib import Path
import GPUtil
from ultralytics import YOLO
import torch
import pandas as pd
from PIL import Image
import cv2
from torch.utils.tensorboard import SummaryWriter
import subprocess
import threading
import webbrowser
import socket
# 设置默认编码为utf-8
if sys.platform.startswith('win'):
import codecs
sys.stdout = codecs.getwriter('utf-8')(sys.stdout.buffer)
sys.stderr = codecs.getwriter('utf-8')(sys.stderr.buffer)
# 禁用SSL证书验证
ssl._create_default_https_context = ssl._create_unverified_context
os.environ['CURL_CA_BUNDLE'] = ''
# 设置环境变量,强制使用utf-8编码
os.environ['PYTHONIOENCODING'] = 'utf-8'
class TrainingMonitor:
def __init__(self, save_dir):
self.save_dir = Path(save_dir)
self.save_dir.mkdir(parents=True, exist_ok=True)
# 初始化TensorBoard,直接使用训练目录
self.writer = SummaryWriter(self.save_dir)
self.metrics_history = {
# 训练指标
'box_loss': [], 'cls_loss': [], 'dfl_loss': [],
'map': [], 'map_50_95': [], 'precision': [], 'recall': [], 'f1': [],
'learning_rate': [], 'speed': [], 'epoch_times': [],
# 硬件监控
'gpu_util': [], 'gpu_temp': [], 'gpu_power': [], 'gpu_fan': [],
'cpu_util': [], 'memory_util': [], 'time_stamps': [],
# 性能分析
'batch_time': [], 'data_time': [], 'forward_time': [], 'backward_time': [],
'optimizer_time': [], 'total_time': [],
# 模型分析
'class_map': [], 'confusion_matrix': [], 'feature_maps': [],
'pred_visualizations': [], 'class_distribution': [],
# 数据分析
'label_distribution': [], 'class_balance': [], 'sample_difficulty': []
}
self.class_names = []
self.start_time = datetime.now()
def update_metrics(self, metrics):
"""更新训练指标并记录到TensorBoard"""
for key, value in metrics.items():
if key in self.metrics_history:
self.metrics_history[key].append(value)
# 记录到TensorBoard
if isinstance(value, (int, float)):
self.writer.add_scalar(f'metrics/{key}', value, len(self.metrics_history[key]))
def update_hardware_metrics(self):
"""更新硬件监控指标并记录到TensorBoard"""
# GPU 监控
try:
gpu = GPUtil.getGPUs()[0]
gpu_util = gpu.load * 100
gpu_temp = gpu.temperature
gpu_power = gpu.powerDraw if hasattr(gpu, 'powerDraw') else 0
gpu_fan = gpu.fan if hasattr(gpu, 'fan') else 0
self.metrics_history['gpu_util'].append(gpu_util)
self.metrics_history['gpu_temp'].append(gpu_temp)
self.metrics_history['gpu_power'].append(gpu_power)
self.metrics_history['gpu_fan'].append(gpu_fan)
# 记录到TensorBoard
self.writer.add_scalar('hardware/gpu_util', gpu_util, len(self.metrics_history['gpu_util']))
self.writer.add_scalar('hardware/gpu_temp', gpu_temp, len(self.metrics_history['gpu_temp']))
self.writer.add_scalar('hardware/gpu_power', gpu_power, len(self.metrics_history['gpu_power']))
self.writer.add_scalar('hardware/gpu_fan', gpu_fan, len(self.metrics_history['gpu_fan']))
except:
self.metrics_history['gpu_util'].append(0)
self.metrics_history['gpu_temp'].append(0)
self.metrics_history['gpu_power'].append(0)
self.metrics_history['gpu_fan'].append(0)
# CPU和内存监控
cpu_util = psutil.cpu_percent()
memory_util = psutil.virtual_memory().percent
self.metrics_history['cpu_util'].append(cpu_util)
self.metrics_history['memory_util'].append(memory_util)
self.metrics_history['time_stamps'].append(datetime.now())
# 记录到TensorBoard
self.writer.add_scalar('hardware/cpu_util', cpu_util, len(self.metrics_history['cpu_util']))
self.writer.add_scalar('hardware/memory_util', memory_util, len(self.metrics_history['memory_util']))
# 计算训练时间
elapsed = (datetime.now() - self.start_time).total_seconds()
self.metrics_history['total_time'].append(elapsed)
self.writer.add_scalar('time/total_training_time', elapsed, len(self.metrics_history['total_time']))
def __del__(self):
"""确保在对象销毁时关闭TensorBoard writer"""
if hasattr(self, 'writer'):
self.writer.close()
def plot_performance_metrics(self):
"""绘制详细的性能指标图表"""
fig = plt.figure(figsize=(20, 20))
gs = plt.GridSpec(4, 4, figure=fig)
# 1. 训练损失图(左上2x2)
ax1 = fig.add_subplot(gs[0:2, 0:2])
if self.metrics_history['box_loss']:
ax1.plot(self.metrics_history['box_loss'], label='Box Loss')
ax1.plot(self.metrics_history['cls_loss'], label='Class Loss')
ax1.plot(self.metrics_history['dfl_loss'], label='DFL Loss')
ax1.set_title('训练损失曲线')
ax1.set_xlabel('Epochs')
ax1.set_ylabel('Loss')
ax1.legend()
# 2. mAP和PR曲线(右上1x2)
ax2 = fig.add_subplot(gs[0, 2:])
if self.metrics_history['map']:
ax2.plot(self.metrics_history['map'], label='mAP50')
ax2.plot(self.metrics_history['map_50_95'], label='mAP50-95')
ax2.set_title('mAP曲线')
ax2.set_xlabel('Epochs')
ax2.set_ylabel('mAP')
ax2.legend()
# 3. Precision-Recall曲线(右上第二行1x2)
ax3 = fig.add_subplot(gs[1, 2:])
if self.metrics_history['precision']:
ax3.plot(self.metrics_history['precision'], label='Precision')
ax3.plot(self.metrics_history['recall'], label='Recall')
ax3.set_title('Precision-Recall曲线')
ax3.set_xlabel('Epochs')
ax3.legend()
# 4. 硬件监控(左下2x2)
ax4 = fig.add_subplot(gs[2:, 0:2])
if self.metrics_history['gpu_util']:
times = [t.strftime('%H:%M:%S') for t in self.metrics_history['time_stamps']]
ax4.plot(times, self.metrics_history['gpu_util'], label='GPU使用率(%)')
ax4.plot(times, self.metrics_history['gpu_temp'], label='GPU温度(°C)')
ax4.plot(times, self.metrics_history['gpu_power'], label='GPU功耗(W)')
ax4.set_title('GPU监控')
ax4.set_xlabel('时间')
plt.setp(ax4.xaxis.get_ticklabels(), rotation=45)
ax4.legend()
# 5. CPU和内存监控(右下2x2)
ax5 = fig.add_subplot(gs[2:, 2:])
if self.metrics_history['cpu_util']:
times = [t.strftime('%H:%M:%S') for t in self.metrics_history['time_stamps']]
ax5.plot(times, self.metrics_history['cpu_util'], label='CPU使用率(%)')
ax5.plot(times, self.metrics_history['memory_util'], label='内存使用率(%)')
ax5.set_title('系统资源监控')
ax5.set_xlabel('时间')
plt.setp(ax5.xaxis.get_ticklabels(), rotation=45)
ax5.legend()
plt.tight_layout()
plt.savefig(self.save_dir / 'performance_metrics.png', dpi=300)
plt.close()
def plot_training_metrics(self):
"""绘制训练指标图表"""
fig = plt.figure(figsize=(20, 15))
gs = plt.GridSpec(3, 3, figure=fig)
# 1. 损失曲线(左上)
ax1 = fig.add_subplot(gs[0, 0])
ax1.plot(self.metrics_history['box_loss'], label='Box Loss')
ax1.plot(self.metrics_history['cls_loss'], label='Class Loss')
ax1.plot(self.metrics_history['dfl_loss'], label='DFL Loss')
ax1.set_title('损失曲线')
ax1.set_xlabel('Epochs')
ax1.set_ylabel('Loss')
ax1.legend()
# 2. mAP曲线(中上)
ax2 = fig.add_subplot(gs[0, 1])
ax2.plot(self.metrics_history['map'], label='mAP50')
ax2.plot(self.metrics_history['map_50_95'], label='mAP50-95')
ax2.set_title('mAP曲线')
ax2.set_xlabel('Epochs')
ax2.set_ylabel('mAP')
ax2.legend()
# 3. PR曲线(右上)
ax3 = fig.add_subplot(gs[0, 2])
ax3.plot(self.metrics_history['precision'], label='Precision')
ax3.plot(self.metrics_history['recall'], label='Recall')
ax3.set_title('Precision-Recall曲线')
ax3.set_xlabel('Epochs')
ax3.legend()
# 4. F1-置信度曲线(左中)
ax4 = fig.add_subplot(gs[1, 0])
ax4.plot(self.metrics_history['f1'], label='F1 Score')
ax4.set_title('F1分数趋势')
ax4.set_xlabel('Epochs')
ax4.set_ylabel('F1 Score')
ax4.legend()
# 5. 学习率变化(中中)
ax5 = fig.add_subplot(gs[1, 1])
ax5.plot(self.metrics_history['learning_rate'], label='Learning Rate')
ax5.set_title('学习率变化')
ax5.set_xlabel('Epochs')
ax5.set_ylabel('Learning Rate')
ax5.legend()
# 6. 训练速度(右中)
ax6 = fig.add_subplot(gs[1, 2])
ax6.plot(self.metrics_history['speed'], label='Training Speed')
ax6.set_title('训练速度')
ax6.set_xlabel('Epochs')
ax6.set_ylabel('Images/s')
ax6.legend()
# 7. 时间分布(左下)
ax7 = fig.add_subplot(gs[2, 0])
times = [self.metrics_history['data_time'][-1],
self.metrics_history['forward_time'][-1],
self.metrics_history['backward_time'][-1],
self.metrics_history['optimizer_time'][-1]]
labels = ['Data Loading', 'Forward', 'Backward', 'Optimizer']
ax7.pie(times, labels=labels, autopct='%1.1f%%')
ax7.set_title('训练时间分布')
# 8. 总训练时间(中下)
ax8 = fig.add_subplot(gs[2, 1])
ax8.plot(self.metrics_history['total_time'], label='Total Time')
ax8.set_title('总训练时间')
ax8.set_xlabel('Epochs')
ax8.set_ylabel('Seconds')
ax8.legend()
plt.tight_layout()
plt.savefig(self.save_dir / 'training_metrics.png', dpi=300)
plt.close()
def plot_hardware_dashboard(self):
"""绘制硬件监控仪表盘"""
fig = plt.figure(figsize=(20, 15))
gs = plt.GridSpec(3, 2, figure=fig)
# 1. GPU使用率和温度(左上)
ax1 = fig.add_subplot(gs[0, 0])
times = [t.strftime('%H:%M:%S') for t in self.metrics_history['time_stamps']]
ax1.plot(times, self.metrics_history['gpu_util'], label='GPU使用率(%)')
ax1_twin = ax1.twinx()
ax1_twin.plot(times, self.metrics_history['gpu_temp'], 'r', label='GPU温度(°C)')
ax1.set_title('GPU状态')
ax1.set_xlabel('时间')
plt.setp(ax1.xaxis.get_ticklabels(), rotation=45)
ax1.legend(loc='upper left')
ax1_twin.legend(loc='upper right')
# 2. GPU功耗和风扇(右上)
ax2 = fig.add_subplot(gs[0, 1])
ax2.plot(times, self.metrics_history['gpu_power'], label='GPU功耗(W)')
ax2_twin = ax2.twinx()
ax2_twin.plot(times, self.metrics_history['gpu_fan'], 'r', label='风扇转速(%)')
ax2.set_title('GPU功耗和散热')
ax2.set_xlabel('时间')
plt.setp(ax2.xaxis.get_ticklabels(), rotation=45)
ax2.legend(loc='upper left')
ax2_twin.legend(loc='upper right')
# 3. CPU使用率(左中)
ax3 = fig.add_subplot(gs[1, 0])
ax3.plot(times, self.metrics_history['cpu_util'], label='CPU使用率(%)')
ax3.set_title('CPU使用率')
ax3.set_xlabel('时间')
plt.setp(ax3.xaxis.get_ticklabels(), rotation=45)
ax3.legend()
# 4. 内存使用率(右中)
ax4 = fig.add_subplot(gs[1, 1])
ax4.plot(times, self.metrics_history['memory_util'], label='内存使用率(%)')
ax4.set_title('内存使用率')
ax4.set_xlabel('时间')
plt.setp(ax4.xaxis.get_ticklabels(), rotation=45)
ax4.legend()
plt.tight_layout()
plt.savefig(self.save_dir / 'hardware_dashboard.png', dpi=300)
plt.close()
def plot_model_analysis(self):
"""绘制模型分析图表"""
if not self.class_names:
return
fig = plt.figure(figsize=(20, 15))
gs = plt.GridSpec(2, 2, figure=fig)
# 1. 类别性能分析(左上)
ax1 = fig.add_subplot(gs[0, 0])
if self.metrics_history['class_map']:
class_map = self.metrics_history['class_map'][-1]
sns.barplot(x=list(self.class_names), y=class_map, ax=ax1)
ax1.set_title('各类别mAP')
ax1.set_xticklabels(ax1.get_xticklabels(), rotation=45)
# 2. 混淆矩阵(右上)
ax2 = fig.add_subplot(gs[0, 1])
if self.metrics_history['confusion_matrix']:
conf_matrix = self.metrics_history['confusion_matrix'][-1]
sns.heatmap(conf_matrix, annot=True, fmt='d', cmap='Blues',
xticklabels=self.class_names, yticklabels=self.class_names,
ax=ax2)
ax2.set_title('混淆矩阵')
# 3. 类别分布(左下)
ax3 = fig.add_subplot(gs[1, 0])
if self.metrics_history['class_distribution']:
dist = self.metrics_history['class_distribution'][-1]
sns.barplot(x=list(self.class_names), y=dist, ax=ax3)
ax3.set_title('数据集类别分布')
ax3.set_xticklabels(ax3.get_xticklabels(), rotation=45)
# 4. 样本难度分布(右下)
ax4 = fig.add_subplot(gs[1, 1])
if self.metrics_history['sample_difficulty']:
diff = self.metrics_history['sample_difficulty'][-1]
sns.histplot(diff, bins=50, ax=ax4)
ax4.set_title('样本难度分布')
plt.tight_layout()
plt.savefig(self.save_dir / 'model_analysis.png', dpi=300)
plt.close()
def update_training_progress(self, epoch, epochs, metrics):
"""更新训练进度和指标"""
self.update_metrics(metrics)
self.update_hardware_metrics()
# 每10个epoch更新一次图表
if epoch % 10 == 0 or epoch == epochs - 1:
self.plot_training_metrics()
self.plot_hardware_dashboard()
self.plot_model_analysis()
def plot_training_curves(self):
"""绘制训练曲线"""
fig, axes = plt.subplots(2, 2, figsize=(15, 12))
fig.suptitle('训练性能指标')
# Loss曲线
axes[0, 0].plot(self.metrics_history['loss'])
axes[0, 0].set_title('Loss曲线')
axes[0, 0].set_xlabel('Epochs')
axes[0, 0].set_ylabel('Loss')
# mAP曲线
axes[0, 1].plot(self.metrics_history['map'])
axes[0, 1].set_title('mAP曲线')
axes[0, 1].set_xlabel('Epochs')
axes[0, 1].set_ylabel('mAP')
# Precision-Recall曲线
axes[1, 0].plot(self.metrics_history['precision'], label='Precision')
axes[1, 0].plot(self.metrics_history['recall'], label='Recall')
axes[1, 0].set_title('Precision-Recall曲线')
axes[1, 0].set_xlabel('Epochs')
axes[1, 0].legend()
# F1曲线
axes[1, 1].plot(self.metrics_history['f1'])
axes[1, 1].set_title('F1分数曲线')
axes[1, 1].set_xlabel('Epochs')
axes[1, 1].set_ylabel('F1 Score')
plt.tight_layout()
plt.savefig(self.save_dir / 'training_curves.png')
plt.close()
def plot_hardware_metrics(self):
"""绘制硬件监控图表"""
fig, axes = plt.subplots(3, 1, figsize=(15, 12))
fig.suptitle('硬件监控指标')
time_stamps = [t.strftime('%H:%M:%S') for t in self.metrics_history['time_stamps']]
# GPU使用率和温度
ax1 = axes[0]
ax1.plot(time_stamps, self.metrics_history['gpu_util'], label='GPU使用率(%)')
ax1.plot(time_stamps, self.metrics_history['gpu_temp'], label='GPU温度(°C)')
ax1.set_title('GPU状态监控')
ax1.legend()
plt.setp(ax1.xaxis.get_ticklabels(), rotation=45)
# CPU使用率
ax2 = axes[1]
ax2.plot(time_stamps, self.metrics_history['cpu_util'], label='CPU使用率(%)', color='orange')
ax2.set_title('CPU使用率监控')
ax2.legend()
plt.setp(ax2.xaxis.get_ticklabels(), rotation=45)
# 内存使用率
ax3 = axes[2]
ax3.plot(time_stamps, self.metrics_history['memory_util'], label='内存使用率(%)', color='green')
ax3.set_title('内存使用率监控')
ax3.legend()
plt.setp(ax3.xaxis.get_ticklabels(), rotation=45)
plt.tight_layout()
plt.savefig(self.save_dir / 'hardware_metrics.png')
plt.close()
def plot_confusion_matrix(self, conf_matrix, class_names):
"""绘制混淆矩阵"""
plt.figure(figsize=(10, 8))
sns.heatmap(conf_matrix, annot=True, fmt='d', cmap='Blues',
xticklabels=class_names, yticklabels=class_names)
plt.title('混淆矩阵')
plt.xlabel('预测类别')
plt.ylabel('真实类别')
plt.savefig(self.save_dir / 'confusion_matrix.png')
plt.close()
def plot_class_distribution(self, class_counts, class_names):
"""绘制类别分布图"""
plt.figure(figsize=(12, 6))
sns.barplot(x=class_names, y=class_counts)
plt.title('数据集类别分布')
plt.xlabel('类别')
plt.ylabel('样本数量')
plt.xticks(rotation=45)
plt.tight_layout()
plt.savefig(self.save_dir / 'class_distribution.png')
plt.close()
def parse_args():
"""解析命令行参数"""
parser = argparse.ArgumentParser(description='Train YOLOv8 model')
parser.add_argument('--model', type=str, default='yolov8n.pt',
help='模型路径或名称')
parser.add_argument('--data', type=str, default='data.yaml',
help='数据配置文件路径')
parser.add_argument('--epochs', type=int, default=100,
help='训练轮数')
parser.add_argument('--imgsz', type=int, default=640,
help='输入图像大小')
parser.add_argument('--batch', type=int, default=16,
help='批次大小')
parser.add_argument('--device', type=str, default='0',
help='训练设备')
parser.add_argument('--workers', type=int, default=8,
help='数据加载线程数')
parser.add_argument('--project', type=str, default='runs/train',
help='项目输出根目录')
parser.add_argument('--name', type=str, default='exp',
help='实验名称')
parser.add_argument('--resume', action='store_true',
help='是否从检查点恢复')
return parser.parse_args()
def get_all_ip_addresses():
"""获取所有网络接口的IP地址"""
ip_list = []
try:
# 获取所有网络接口
interfaces = socket.getaddrinfo(host=socket.gethostname(), port=None, family=socket.AF_INET)
# 提取不重复的IP地址
ip_list = list(set(item[4][0] for item in interfaces))
# 过滤掉回环地址
ip_list = [ip for ip in ip_list if not ip.startswith('127.')]
except:
pass
return ip_list
def start_tensorboard(logdir, port=6006):
"""启动TensorBoard服务,支持局域网访问"""
# 获取所有网络接口IP地址
ip_addresses = get_all_ip_addresses()
# 启动TensorBoard,绑定到所有网络接口
cmd = f"tensorboard --logdir={logdir} --port={port} --host=0.0.0.0"
process = subprocess.Popen(cmd, shell=True)
# 等待TensorBoard服务启动
time.sleep(3)
# 在默认浏览器中打开TensorBoard
webbrowser.open(f"http://localhost:{port}")
# 打印访问信息
print("\n" + "="*50)
print("TensorBoard 服务已启动")
print("="*50)
print("\n1. 本机访问地址:")
print(f" http://localhost:{port}")
if ip_addresses:
print("\n2. 局域网访问地址:")
for ip in ip_addresses:
print(f" http://{ip}:{port}")
print("\n注意事项:")
print("1. 确保防火墙允许 {port} 端口的访问")
print("2. 如果使用WSL或虚拟机,请确保网络设置为桥接模式")
print("3. 其他设备可以通过以上任意局域网地址访问")
print("="*50 + "\n")
return process
def train_yolo(args):
"""训练YOLOv8模型"""
# 初始化模型和监控器
model = YOLO(args.model)
# 设置TensorBoard日志目录为训练输出目录
tensorboard_dir = Path(f"{args.project}/{args.name}")
monitor = TrainingMonitor(tensorboard_dir)
# 启动TensorBoard
tensorboard_process = None
try:
print("\n正在启动TensorBoard服务...")
tensorboard_process = start_tensorboard(tensorboard_dir)
except Exception as e:
print(f"\nTensorBoard启动失败: {str(e)}")
print("您可以手动启动TensorBoard(支持局域网访问):")
print(f"tensorboard --logdir={tensorboard_dir} --host=0.0.0.0")
print("\n要获取局域网访问地址,请运行:")
print("ipconfig (Windows) 或 ifconfig (Linux/Mac)")
try:
# 设置回调函数来更新监控器
def on_train_epoch_end(trainer):
metrics = {
# 训练指标
'box_loss': float(trainer.loss_items[0]),
'cls_loss': float(trainer.loss_items[1]),
'dfl_loss': float(trainer.loss_items[2]),
'map': float(trainer.metrics.get('metrics/mAP50(B)', 0)),
'map_50_95': float(trainer.metrics.get('metrics/mAP50-95(B)', 0)),
'precision': float(trainer.metrics.get('metrics/precision(B)', 0)),
'recall': float(trainer.metrics.get('metrics/recall(B)', 0)),
'f1': float(trainer.metrics.get('metrics/F1(B)', 0)),
'learning_rate': float(trainer.optimizer.param_groups[0]['lr']),
'speed': float(trainer.speed['t']),
# 时间指标
'data_time': float(trainer.speed.get('data', 0)),
'forward_time': float(trainer.speed.get('forward', 0)),
'backward_time': float(trainer.speed.get('backward', 0)),
'optimizer_time': float(trainer.speed.get('optimizer', 0)),
# 模型分析
'class_map': [float(m) for m in trainer.metrics.get('metrics/mAP50(B)_per_class', [0]*len(trainer.names))],
'confusion_matrix': trainer.confusion_matrix.matrix if hasattr(trainer, 'confusion_matrix') else None,
# 数据分析
'class_distribution': trainer.dataset.cls.bincount().tolist() if hasattr(trainer.dataset, 'cls') else None,
'sample_difficulty': trainer.loss_items.mean(dim=1).tolist() if hasattr(trainer, 'loss_items') else None
}
monitor.update_training_progress(trainer.epoch, trainer.epochs, metrics)
# 添加学习率到TensorBoard
current_lr = trainer.optimizer.param_groups[0]['lr']
monitor.writer.add_scalar('train/learning_rate', current_lr, trainer.epoch)
# 如果有验证结果,添加到TensorBoard
if hasattr(trainer, 'validator') and trainer.validator is not None:
val_results = trainer.validator.metrics
for k, v in val_results.items():
if isinstance(v, (int, float)):
monitor.writer.add_scalar(f'val/{k}', v, trainer.epoch)
# 开始训练
results = model.train(
data=args.data,
epochs=args.epochs,
imgsz=args.imgsz,
batch=args.batch,
device=args.device,
workers=args.workers,
project=args.project,
name=args.name,
exist_ok=True,
pretrained=True,
optimizer='auto',
amp=True,
verbose=True,
seed=0,
deterministic=True,
resume=args.resume,
patience=100,
save_period=50,
lr0=0.01,
lrf=0.001,
momentum=0.937,
weight_decay=0.0005,
warmup_epochs=3.0,
warmup_momentum=0.8,
warmup_bias_lr=0.1,
box=7.5,
cls=0.5,
dfl=1.5,
plots=True,
save_json=False,
save_hybrid=False,
conf=None,
iou=0.7,
max_det=300,
half=False,
dnn=False
)
# 训练结束后生成所有图表
monitor.plot_training_metrics()
monitor.plot_hardware_dashboard()
monitor.plot_model_analysis()
print("\n训练完成!")
print(f"结果保存在 {args.project}/{args.name}")
# 等待用户查看TensorBoard
if tensorboard_process:
input("\n按回车键结束训练和TensorBoard服务...")
tensorboard_process.terminate()
return model, results
except Exception as e:
print(f"训练出错: {str(e)}")
if tensorboard_process:
tensorboard_process.terminate()
raise e
def main():
"""主函数:解析参数并执行训练流程"""
args = parse_args()
try:
model, results = train_yolo(args)
print(f"\n最终模型保存在 {args.project}/{args.name}/weights/best.pt")
except KeyboardInterrupt:
print("\n训练被用户中断")
except Exception as e:
print(f"\n训练失败: {str(e)}")
if __name__ == '__main__':
main() 数据分析代码(总体)
import pandas as pd
import matplotlib.pyplot as plt
import seaborn as sns
import numpy as np
from matplotlib import font_manager
import matplotlib as mpl
import sys
import platform

class FontManager:
    @staticmethod
    def setup_chinese_font():
        """设置中文字体,优先使用系统自带的中文字体"""
        system = platform.system()

        # Windows系统
        if system == "Windows":
            font_list = [
                'Microsoft YaHei',   # 微软雅黑
                'SimHei',           # 黑体
                'SimSun',           # 宋体
                'KaiTi',            # 楷体
                'FangSong'          # 仿宋
            ]
        # macOS系统
        elif system == "Darwin":
            font_list = [
                'Arial Unicode MS',
                'Heiti TC',
                'STHeiti'
            ]
        # Linux系统
        else:
            font_list = [
                'WenQuanYi Micro Hei',
                'Droid Sans Fallback',
                'NotoSansCJK'
            ]

        # 尝试设置字体
        font_found = False
        for font_name in font_list:
            try:
                mpl.rcParams['font.sans-serif'] = [font_name]
                mpl.rcParams['axes.unicode_minus'] = False
                plt.rcParams['font.family'] = [font_name]
                # 测试字体是否可用
                fig = plt.figure()
                plt.text(0.5, 0.5, '测试中文字体')
                plt.close(fig)
                font_found = True
                print(f"成功使用字体: {font_name}")
                break
            except:
                continue

        if not font_found:
            print("警告:未能找到合适的中文字体,将使用英文替代")
            return False

        return True

class TrainingAnalyzer:
    def __init__(self, csv_path):
        # 初始化时设置字体
        self.use_chinese = FontManager.setup_chinese_font()
        self.df = pd.read_csv(csv_path)

    def _get_title(self, chinese, english):
        """根据字体支持情况返回标题"""
        return chinese if self.use_chinese else english

    def plot_metrics(self):
        """绘制训练指标图"""
        fig, axes = plt.subplots(2, 2, figsize=(15, 12))

        # 设置总标题
        title = self._get_title('训练过程分析', 'Training Process Analysis')
        fig.suptitle(title, fontsize=16)

        # 损失函数
        self._plot_losses(axes[0, 0])

        # 评估指标
        self._plot_evaluation_metrics(axes[0, 1])

        # mAP指标
        self._plot_map_metrics(axes[1, 0])

        # 学习率
        self._plot_learning_rate(axes[1, 1])

        plt.tight_layout()
        plt.savefig('training_analysis.png', dpi=300, bbox_inches='tight')
        plt.close()

    def _plot_losses(self, ax):
        """绘制损失函数"""
        ax.plot(self.df['epoch'], self.df['train/box_loss'], label='Box Loss')
        ax.plot(self.df['epoch'], self.df['train/cls_loss'], label='Class Loss')
        ax.plot(self.df['epoch'], self.df['train/dfl_loss'], label='DFL Loss')
        title = self._get_title('损失函数变化', 'Loss Functions')
        ax.set_title(title)
        ax.set_xlabel('Epoch')
        ax.set_ylabel('Loss')
        ax.legend()
        ax.grid(True)

    def _plot_evaluation_metrics(self, ax):
        """绘制评估指标"""
        ax.plot(self.df['epoch'], self.df['metrics/precision(B)'], label='Precision')
        ax.plot(self.df['epoch'], self.df['metrics/recall(B)'], label='Recall')
        title = self._get_title('精确率和召回率', 'Precision & Recall')
        ax.set_title(title)
        ax.set_xlabel('Epoch')
        ax.set_ylabel('Score')
        ax.legend()
        ax.grid(True)

    def _plot_map_metrics(self, ax):
        """绘制mAP指标"""
        ax.plot(self.df['epoch'], self.df['metrics/mAP50(B)'], label='mAP50')
        ax.plot(self.df['epoch'], self.df['metrics/mAP50-95(B)'], label='mAP50-95')
        title = self._get_title('mAP指标变化', 'mAP Metrics')
        ax.set_title(title)
        ax.set_xlabel('Epoch')
        ax.set_ylabel('mAP')
        ax.legend()
        ax.grid(True)

    def _plot_learning_rate(self, ax):
        """绘制学习率变化"""
        ax.plot(self.df['epoch'], self.df['lr/pg0'])
        title = self._get_title('学习率变化', 'Learning Rate')
        ax.set_title(title)
        ax.set_xlabel('Epoch')
        ax.set_ylabel('Learning Rate')
        ax.set_yscale('log')
        ax.grid(True)

    def analyze_metrics(self):
        """分析训练指标"""
        metrics = {
            'Precision': self.df['metrics/precision(B)'],
            'Recall': self.df['metrics/recall(B)'],
            'mAP50': self.df['metrics/mAP50(B)'],
            'mAP50-95': self.df['metrics/mAP50-95(B)']
        }

        analysis = {}
        for name, metric in metrics.items():
            analysis[name] = {
                'max': metric.max(),
                'min': metric.min(),
                'mean': metric.mean(),
                'std': metric.std(),
                'final': metric.iloc[-1],
                'max_epoch': metric.idxmax() + 1
            }

        return analysis

    def print_analysis(self):
        """打印分析结果"""
        analysis = self.analyze_metrics()
        print("\n=== Training Metrics Analysis ===\n")
        for metric, stats in analysis.items():
            print(f"\n{metric}:")
            print(f"Max: {stats['max']:.4f} (Epoch {stats['max_epoch']})")
            print(f"Min: {stats['min']:.4f}")
            print(f"Mean: {stats['mean']:.4f}")
            print(f"Std: {stats['std']:.4f}")
            print(f"Final: {stats['final']:.4f}")

def main():
    analyzer = TrainingAnalyzer('results.csv')
    analyzer.plot_metrics()
    analyzer.print_analysis()

if __name__ == "__main__":
    main()
每一百轮分析:
import pandas as pd
import matplotlib.pyplot as plt
import seaborn as sns
import numpy as np
from matplotlib import font_manager
import matplotlib as mpl
import sys
import platform

class FontManager:
    @staticmethod
    def setup_chinese_font():
        """设置中文字体,优先使用系统自带的中文字体"""
        system = platform.system()

        # Windows系统
        if system == "Windows":
            font_list = [
                'Microsoft YaHei',   # 微软雅黑
                'SimHei',           # 黑体
                'SimSun',           # 宋体
                'KaiTi',            # 楷体
                'FangSong'          # 仿宋
            ]
        # macOS系统
        elif system == "Darwin":
            font_list = [
                'Arial Unicode MS',
                'Heiti TC',
                'STHeiti'
            ]
        # Linux系统
        else:
            font_list = [
                'WenQuanYi Micro Hei',
                'Droid Sans Fallback',
                'NotoSansCJK'
            ]

        # 尝试设置字体
        font_found = False
        for font_name in font_list:
            try:
                mpl.rcParams['font.sans-serif'] = [font_name]
                mpl.rcParams['axes.unicode_minus'] = False
                plt.rcParams['font.family'] = [font_name]
                # 测试字体是否可用
                fig = plt.figure()
                plt.text(0.5, 0.5, '测试中文字体')
                plt.close(fig)
                font_found = True
                print(f"成功使用字体: {font_name}")
                break
            except:
                continue

        if not font_found:
            print("警告:未能找到合适的中文字体,将使用英文替代")
            return False

        return True

class TrainingAnalyzer:
    def __init__(self, csv_path):
        # 初始化时设置字体
        self.use_chinese = FontManager.setup_chinese_font()
        self.df = pd.read_csv(csv_path)

    def _get_title(self, chinese, english):
        """根据字体支持情况返回标题"""
        return chinese if self.use_chinese else english

    def plot_metrics(self):
        """绘制训练指标图"""
        fig, axes = plt.subplots(2, 2, figsize=(15, 12))

        # 设置总标题
        title = self._get_title('训练过程分析', 'Training Process Analysis')
        fig.suptitle(title, fontsize=16)

        # 损失函数
        self._plot_losses(axes[0, 0])

        # 评估指标
        self._plot_evaluation_metrics(axes[0, 1])

        # mAP指标
        self._plot_map_metrics(axes[1, 0])

        # 学习率
        self._plot_learning_rate(axes[1, 1])

        plt.tight_layout()
        plt.savefig('training_analysis.png', dpi=300, bbox_inches='tight')
        plt.close()

    def _plot_losses(self, ax):
        """绘制损失函数"""
        ax.plot(self.df['epoch'], self.df['train/box_loss'], label='Box Loss')
        ax.plot(self.df['epoch'], self.df['train/cls_loss'], label='Class Loss')
        ax.plot(self.df['epoch'], self.df['train/dfl_loss'], label='DFL Loss')
        title = self._get_title('损失函数变化', 'Loss Functions')
        ax.set_title(title)
        ax.set_xlabel('Epoch')
        ax.set_ylabel('Loss')
        ax.legend()
        ax.grid(True)

    def _plot_evaluation_metrics(self, ax):
        """绘制评估指标"""
        ax.plot(self.df['epoch'], self.df['metrics/precision(B)'], label='Precision')
        ax.plot(self.df['epoch'], self.df['metrics/recall(B)'], label='Recall')
        title = self._get_title('精确率和召回率', 'Precision & Recall')
        ax.set_title(title)
        ax.set_xlabel('Epoch')
        ax.set_ylabel('Score')
        ax.legend()
        ax.grid(True)

    def _plot_map_metrics(self, ax):
        """绘制mAP指标"""
        ax.plot(self.df['epoch'], self.df['metrics/mAP50(B)'], label='mAP50')
        ax.plot(self.df['epoch'], self.df['metrics/mAP50-95(B)'], label='mAP50-95')
        title = self._get_title('mAP指标变化', 'mAP Metrics')
        ax.set_title(title)
        ax.set_xlabel('Epoch')
        ax.set_ylabel('mAP')
        ax.legend()
        ax.grid(True)

    def _plot_learning_rate(self, ax):
        """绘制学习率变化"""
        ax.plot(self.df['epoch'], self.df['lr/pg0'])
        title = self._get_title('学习率变化', 'Learning Rate')
        ax.set_title(title)
        ax.set_xlabel('Epoch')
        ax.set_ylabel('Learning Rate')
        ax.set_yscale('log')
        ax.grid(True)

    def analyze_metrics(self):
        """分析训练指标"""
        metrics = {
            'Precision': self.df['metrics/precision(B)'],
            'Recall': self.df['metrics/recall(B)'],
            'mAP50': self.df['metrics/mAP50(B)'],
            'mAP50-95': self.df['metrics/mAP50-95(B)']
        }

        analysis = {}
        for name, metric in metrics.items():
            analysis[name] = {
                'max': metric.max(),
                'min': metric.min(),
                'mean': metric.mean(),
                'std': metric.std(),
                'final': metric.iloc[-1],
                'max_epoch': metric.idxmax() + 1
            }

        return analysis

    def print_analysis(self):
        """打印分析结果"""
        analysis = self.analyze_metrics()
        print("\n=== Training Metrics Analysis ===\n")
        for metric, stats in analysis.items():
            print(f"\n{metric}:")
            print(f"Max: {stats['max']:.4f} (Epoch {stats['max_epoch']})")
            print(f"Min: {stats['min']:.4f}")
            print(f"Mean: {stats['mean']:.4f}")
            print(f"Std: {stats['std']:.4f}")
            print(f"Final: {stats['final']:.4f}")

def main():
    analyzer = TrainingAnalyzer('results.csv')
    analyzer.plot_metrics()
    analyzer.print_analysis()

if __name__ == "__main__":
    main()