ggplot2绘制单列热图+显著性注释
本文记录单列热图模板。
1. 导入包和数据
数据:
通过网盘分享的文件:单列热图
链接: https://pan.baidu.com/s/1g4Qx9FI5SHA9w-grUoqSLg?pwd=tv7j 提取码: tv7j
#加载R包
library(ggplot2) # Create Elegant Data Visualisations Using the Grammar of Graphics

#加载数据
df <- read.table("data.txt", header = 1, check.names = F, sep = "\t")

##绘图
#自定义颜色
col <- colorRampPalette(c("#00d1b2","white","#f99104"))(50)
2. 绘制单列热图
g1 <- ggplot(df, aes(X, Y))+
#绘制主体的热图
geom_tile(aes(fill = value), width = 0.3, color = "white", linewidth = 0.1)+
#在热图旁边添加相应文字注释
geom_text(data=df[df$group=="A",], aes(1.8, Y, label = label), vjust = 0.5, hjust = 1)+
geom_text(data=df[df$group=="B",], aes(3.3, Y, label = label), vjust = 0.5, hjust = 1)+
#反转坐标轴并调整范围
scale_x_continuous(limits = c(0.8,4.5))+
scale_y_reverse()+
#主题设置及图例设置
theme_void()+
theme(legend.position = "bottom",
strip.background = element_rect(fill = "grey", color = "transparent"),
strip.text = element_text(color="black",size=15))+
scale_fill_gradientn(colors = col, limits = c(-0.3,0.3), name = "Standardized regression coefficients",
breaks = c(-0.3, 0, 0.3))+
guides(fill = guide_colorbar(barwidth = 10, title.position = "bottom",title.vjust = 1))
g1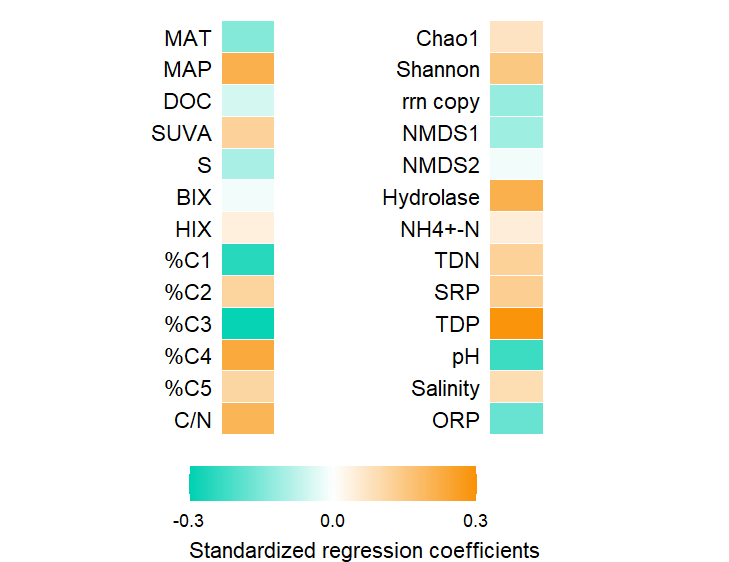 图1 单列热图
3. 添加显著性信息
g2 <- g1 +
  ##添加显著性信息
  geom_text(data=df[df$group=="A",], aes(2, Y, label = sig), vjust = 0.5, hjust = 0.5, size = 6)+
  geom_text(data=df[df$group=="B",], aes(3.5, Y, label = sig), vjust = 0.5, hjust = 0.5, size = 6)
g2
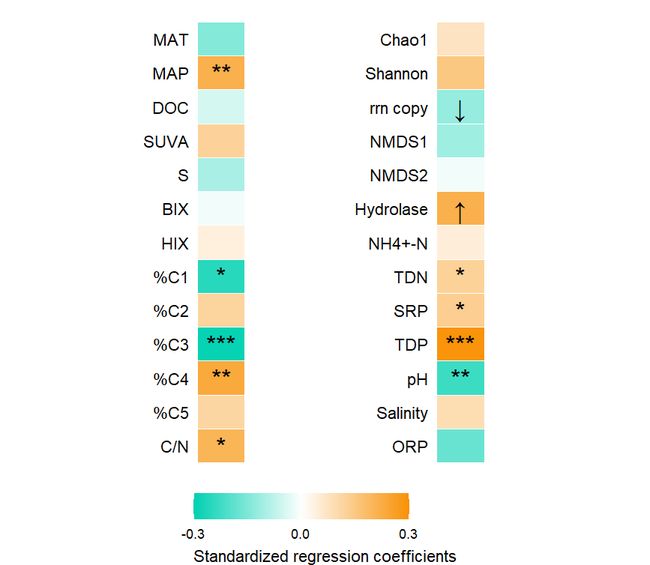 图2 添加热图注释
4. 添加文字注释信息
g3 <- g2 +
#添加两条竖线
geom_segment(aes(x=1.4,xend=1.4,y=0.5,yend=13.5), linetype = 1, color = "black",linewidth=0.6)+
geom_segment(aes(x=2.7,xend=2.7,y=0.5,yend=13.5), linetype = 1, color = "black",linewidth=0.6)+
#在竖直的线旁边添加相应文字信息
geom_text(aes(1.3, 2, label = "Climatic"), angle = 90)+
geom_text(aes(1.3, 9, label = "Substrate properties"), angle = 90)+
geom_text(aes(2.6, 3, label = "Microbial properties"), angle = 90)+
geom_text(aes(2.6, 9, label = "Water chemistry"), angle = 90) +
#这里通过分面形式给图形添加标题,普通标题添加方式暂时没找到怎么设置背景色
facet_grid(~ facet, scales = "free")
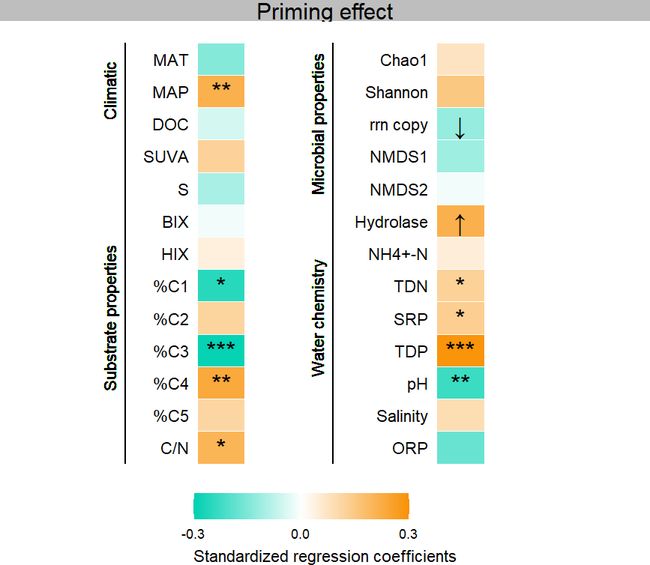
g3 图3 添加文字注释
完整版代码
rm(list=ls())#clear Global Environment
setwd('')#设置工作路径

#加载R包
library(ggplot2) # Create Elegant Data Visualisations Using the Grammar of Graphics

#加载数据
df <- read.table("data.txt", header = 1, check.names = F, sep = "\t")

##绘图
#自定义颜色
col <- colorRampPalette(c("#00d1b2","white","#f99104"))(50)
#绘图
g <- ggplot(df, aes(X, Y))+
  #绘制主体的热图
  geom_tile(aes(fill = value), width = 0.3, color = "white", linewidth = 0.1)+
  #在热图旁边添加相应文字注释
  geom_text(data=df[df$group=="A",], aes(1.8, Y, label = label), vjust = 0.5, hjust = 1)+
  geom_text(data=df[df$group=="B",], aes(3.3, Y, label = label), vjust = 0.5, hjust = 1)+
  #添加两条竖线
  geom_segment(aes(x=1.4,xend=1.4,y=0.5,yend=13.5), linetype = 1, color = "black",linewidth=0.6)+
  geom_segment(aes(x=2.7,xend=2.7,y=0.5,yend=13.5), linetype = 1, color = "black",linewidth=0.6)+
  #在竖直的线旁边添加相应文字信息
  geom_text(aes(1.3, 2, label = "Climatic"), angle = 90)+
  geom_text(aes(1.3, 9, label = "Substrate properties"), angle = 90)+
  geom_text(aes(2.6, 3, label = "Microbial properties"), angle = 90)+
  geom_text(aes(2.6, 9, label = "Water chemistry"), angle = 90)+
  ##添加显著性信息
  geom_text(data=df[df$group=="A",], aes(2, Y, label = sig), vjust = 0.5, hjust = 0.5, size = 6)+
  geom_text(data=df[df$group=="B",], aes(3.5, Y, label = sig), vjust = 0.5, hjust = 0.5, size = 6)+
  #反转坐标轴并调整范围
  scale_x_continuous(limits = c(1.3,3.8))+
  scale_y_reverse()+
  #这里通过分面形式给图形添加标题,普通标题添加方式暂时没找到怎么设置背景色
  facet_grid(~ facet, scales = "free")+
  #主题设置及图例设置
  theme_void()+
  theme(legend.position = "bottom",
        strip.background = element_rect(fill = "grey", color = "transparent"),
        strip.text = element_text(color="black",size=15))+
  scale_fill_gradientn(colors = col, limits = c(-0.3,0.3), name = "Standardized regression coefficients",
                       breaks = c(-0.3, 0, 0.3))+
  guides(fill = guide_colorbar(barwidth = 10, title.position = "bottom",title.vjust = 1))

g
##通过调整RStudio图形窗口显示至合适大小,导出PDF,最后在AI软件中进行细节调整,包括标题及一些特殊字体格式